
Background
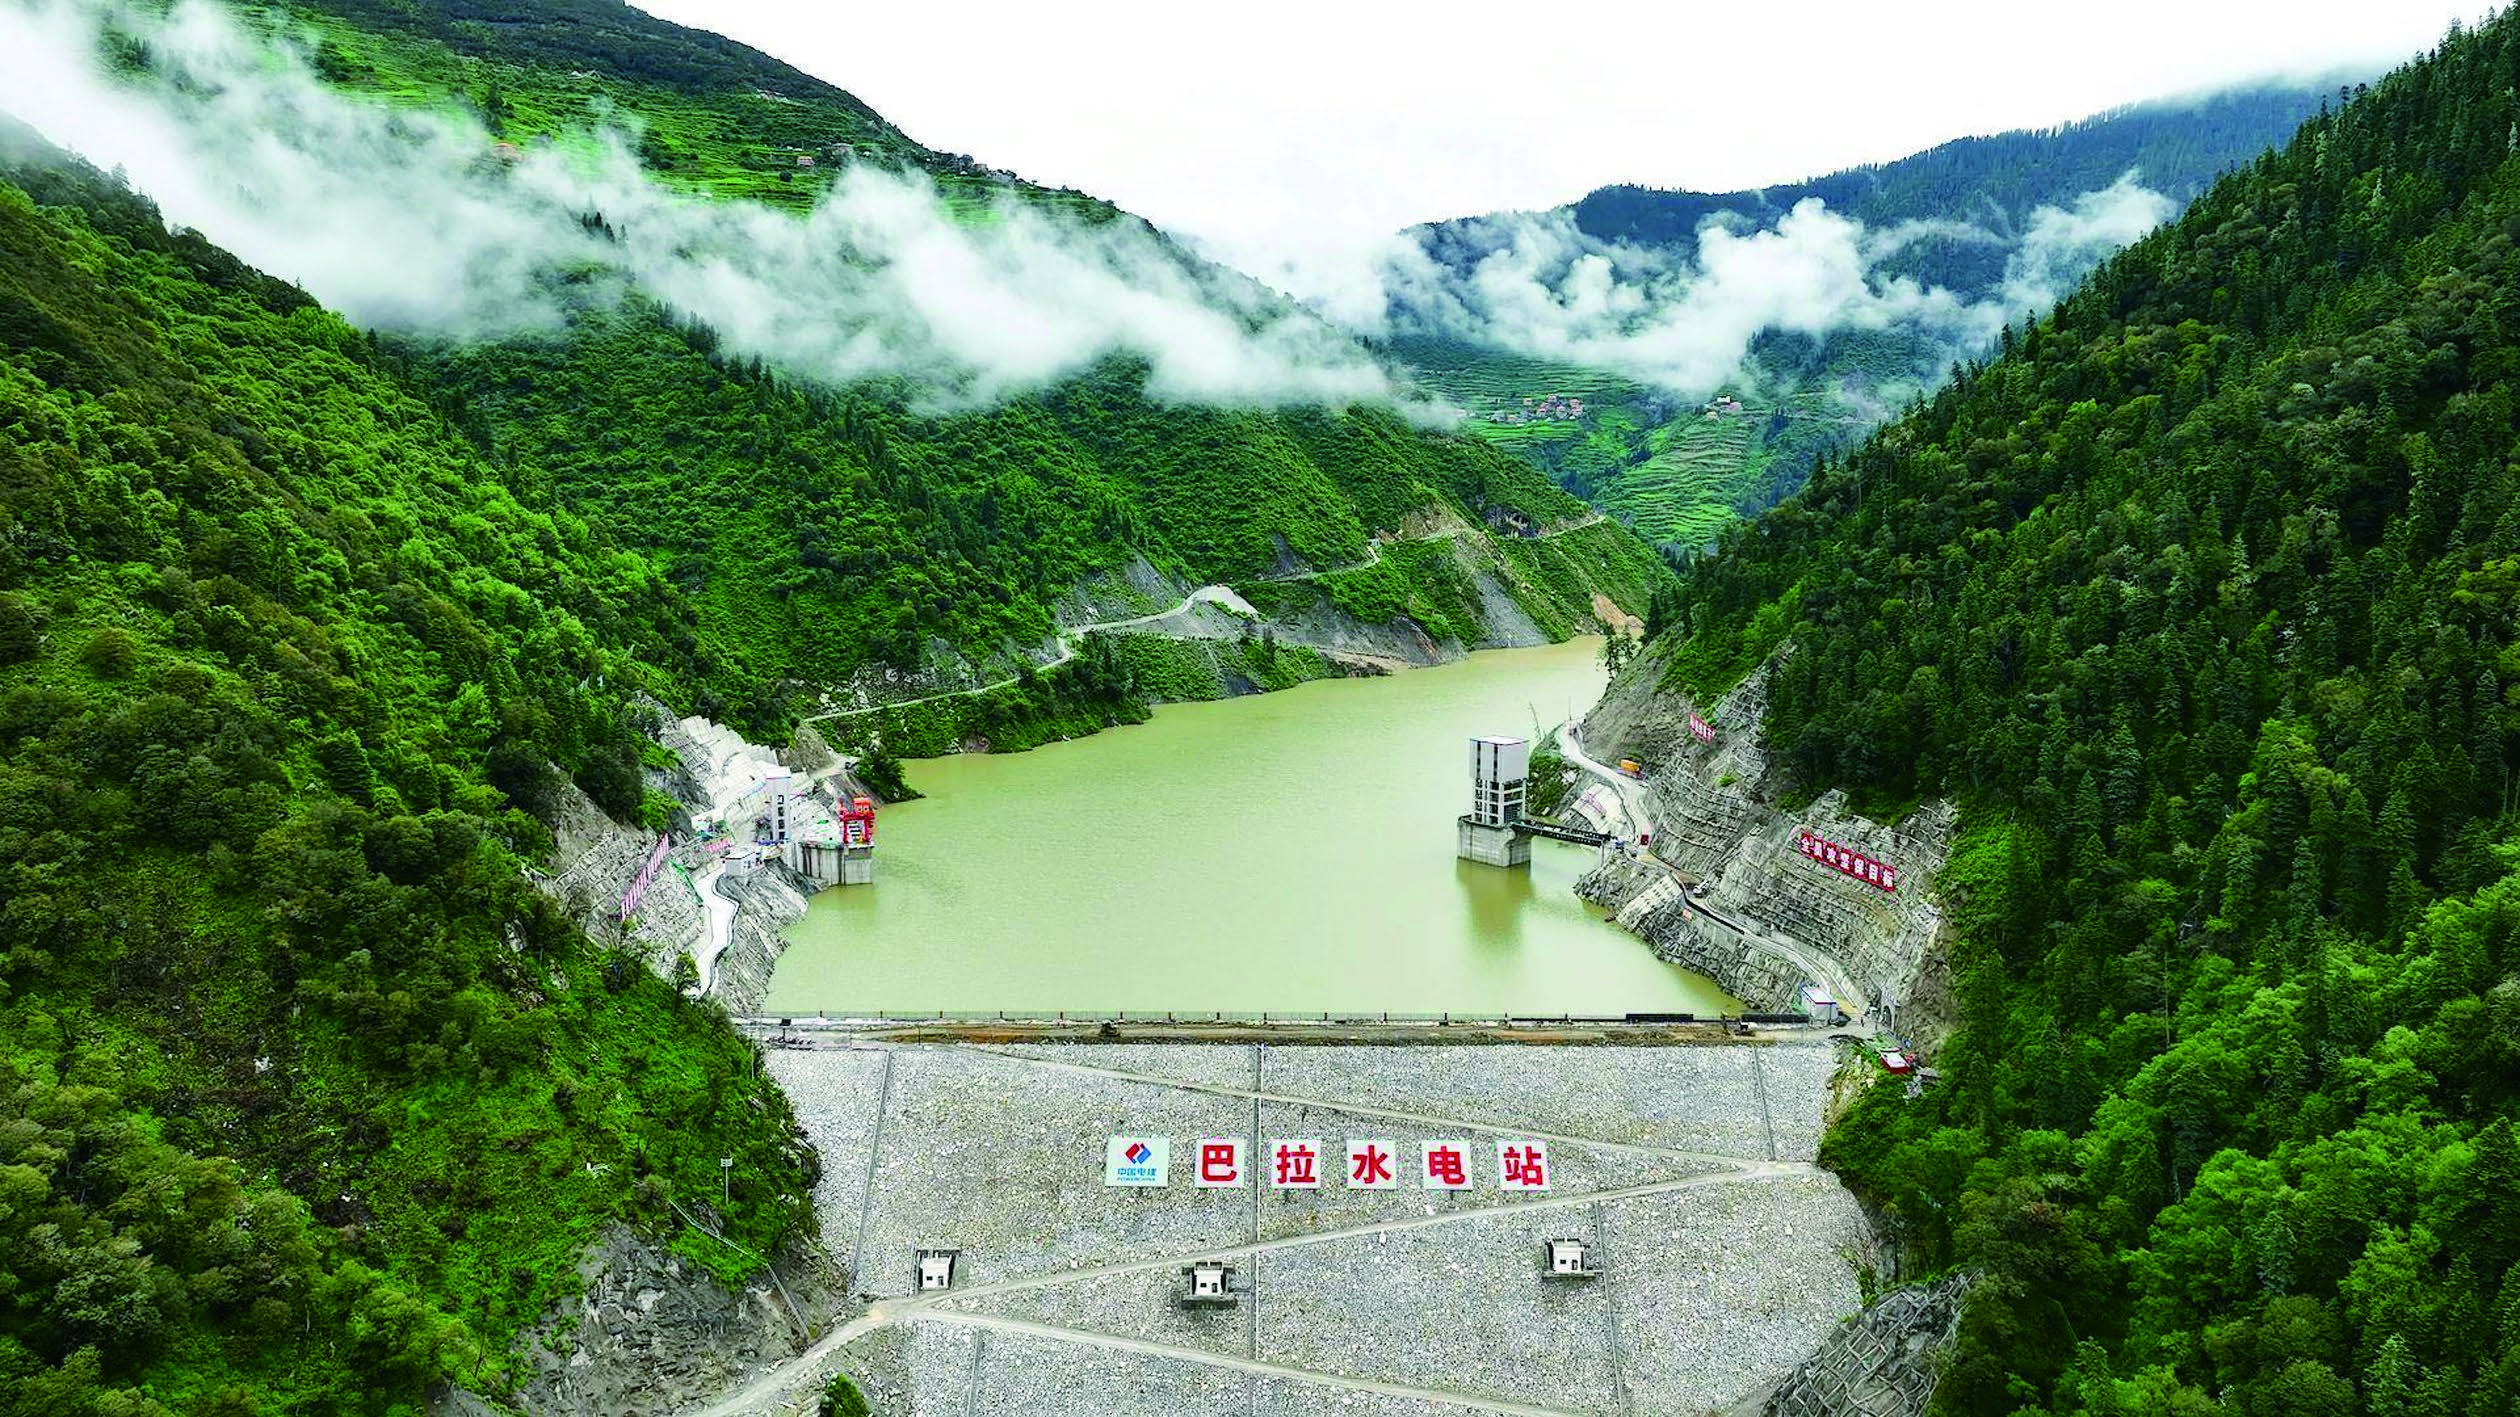
Bala Hydropower Station is in Ma’erkang, Aba Prefecture, Sichuan, China. Its installed capacity is 746,000 kW, with a reservoir capacity of 133.8 million cubic meters and design annual generation of 2.553 billion kWh. Construction began in early 2021, followed by impoundment in early 2025.
| Project detail | Monitoring record |
|---|---|
| Location | Ma’erkang, Sichuan, China |
| Asset | Upstream slope near Sejiang Village, Bala Hydropower Station |
| Instruments | GNSS and RT-1010 Array Displacement Meters |
| Period | June 26, 2025 through late July |
| Reported results | Deformation exceeded 1 m; the rate fell below 1 mm/day by late July, following reservoir release on July 8 |
Challenges
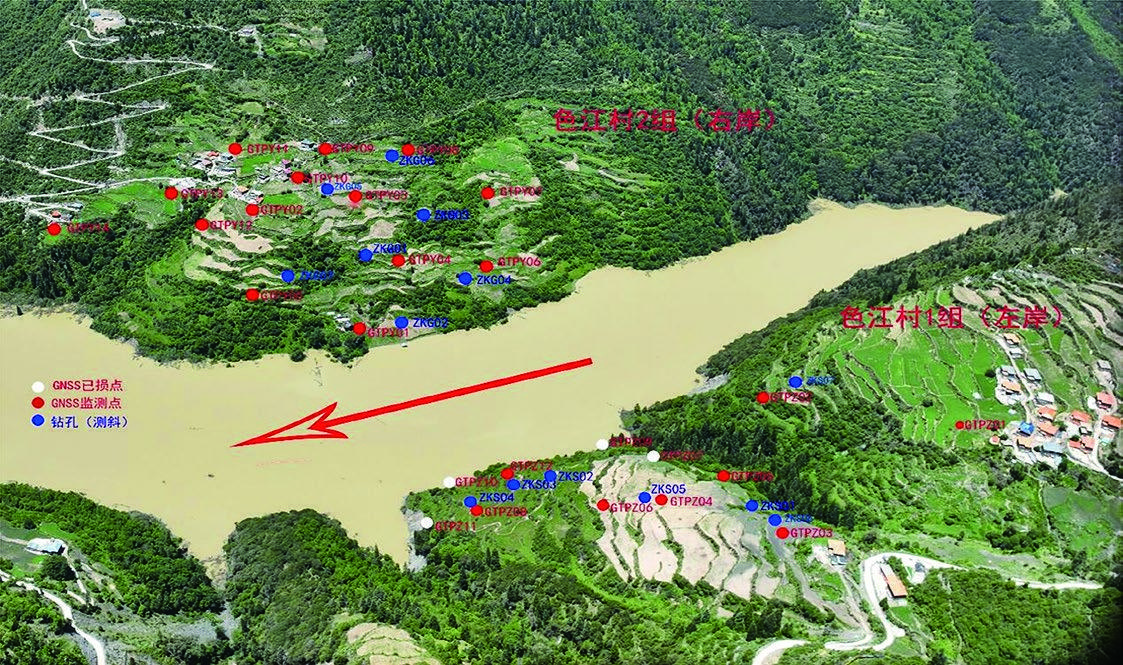
During impoundment in 2025, deformation accelerated on the upstream slope near Sejiang Village. A large landslide entering the river or reservoir could generate a surge, affect the dam and nearby communities, and reduce reservoir capacity through deposited material.
The project investigation associated the movement with sustained rainfall and rising reservoir levels. Infiltration and prolonged submergence can alter the weight and strength of slope materials; changing water pressure also affects the forces acting on the slope. The monitoring team considered these mechanisms when assessing the developing movement.
Surface movement and deformation at depth
The owner needed timely surface and subsurface measurements to assess the slope and inform reservoir management. Surface monitoring would track movement across the slope, while borehole profiles would show how deformation was distributed at depth.
Solution
GNSS and borehole displacement measurements
The automated system combined high-precision GNSS observations with Array Displacement Meters. GNSS tracked surface movement; the borehole arrays measured internal deformation along the monitored depth.
Remote transmission brought both sets of readings to the platform for near-real-time review. This reduced reliance on repeated manual readings at a site where deformation was changing rapidly.
Establishing the borehole direction reference
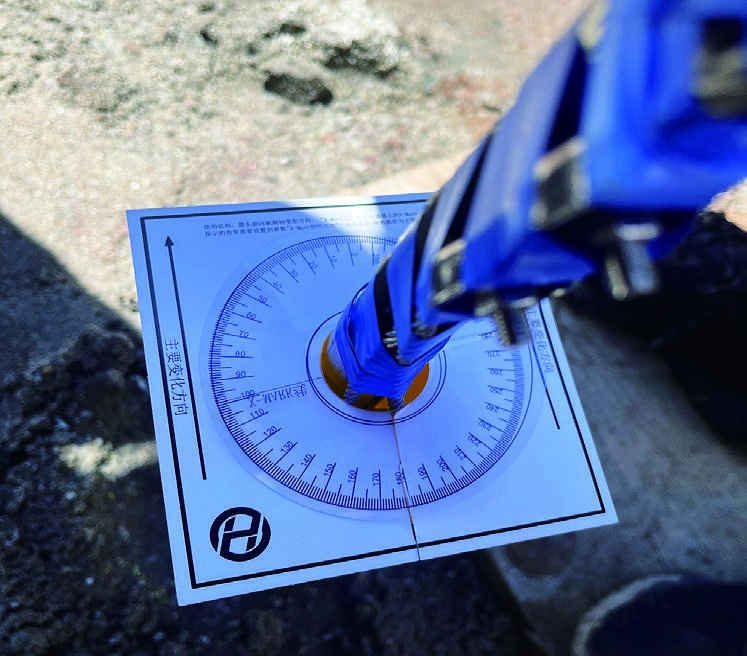
Field photographs record the instrument installation and an orientation reference at the borehole head. A documented measurement direction gives engineers a consistent basis for interpreting displacement profiles and comparing dates.
Results
The published monitoring record runs from installation on June 26, 2025 through late July. Maximum reported deformation during this period exceeded 1 m. Successive depth profiles showed the development of movement within the slope, complementing the GNSS surface observations.
After reservoir release on July 8, the recorded rate of movement declined. The project report records a deformation rate below 1 mm/day by late July. These measurements helped the team assess the slope’s response following reservoir regulation.
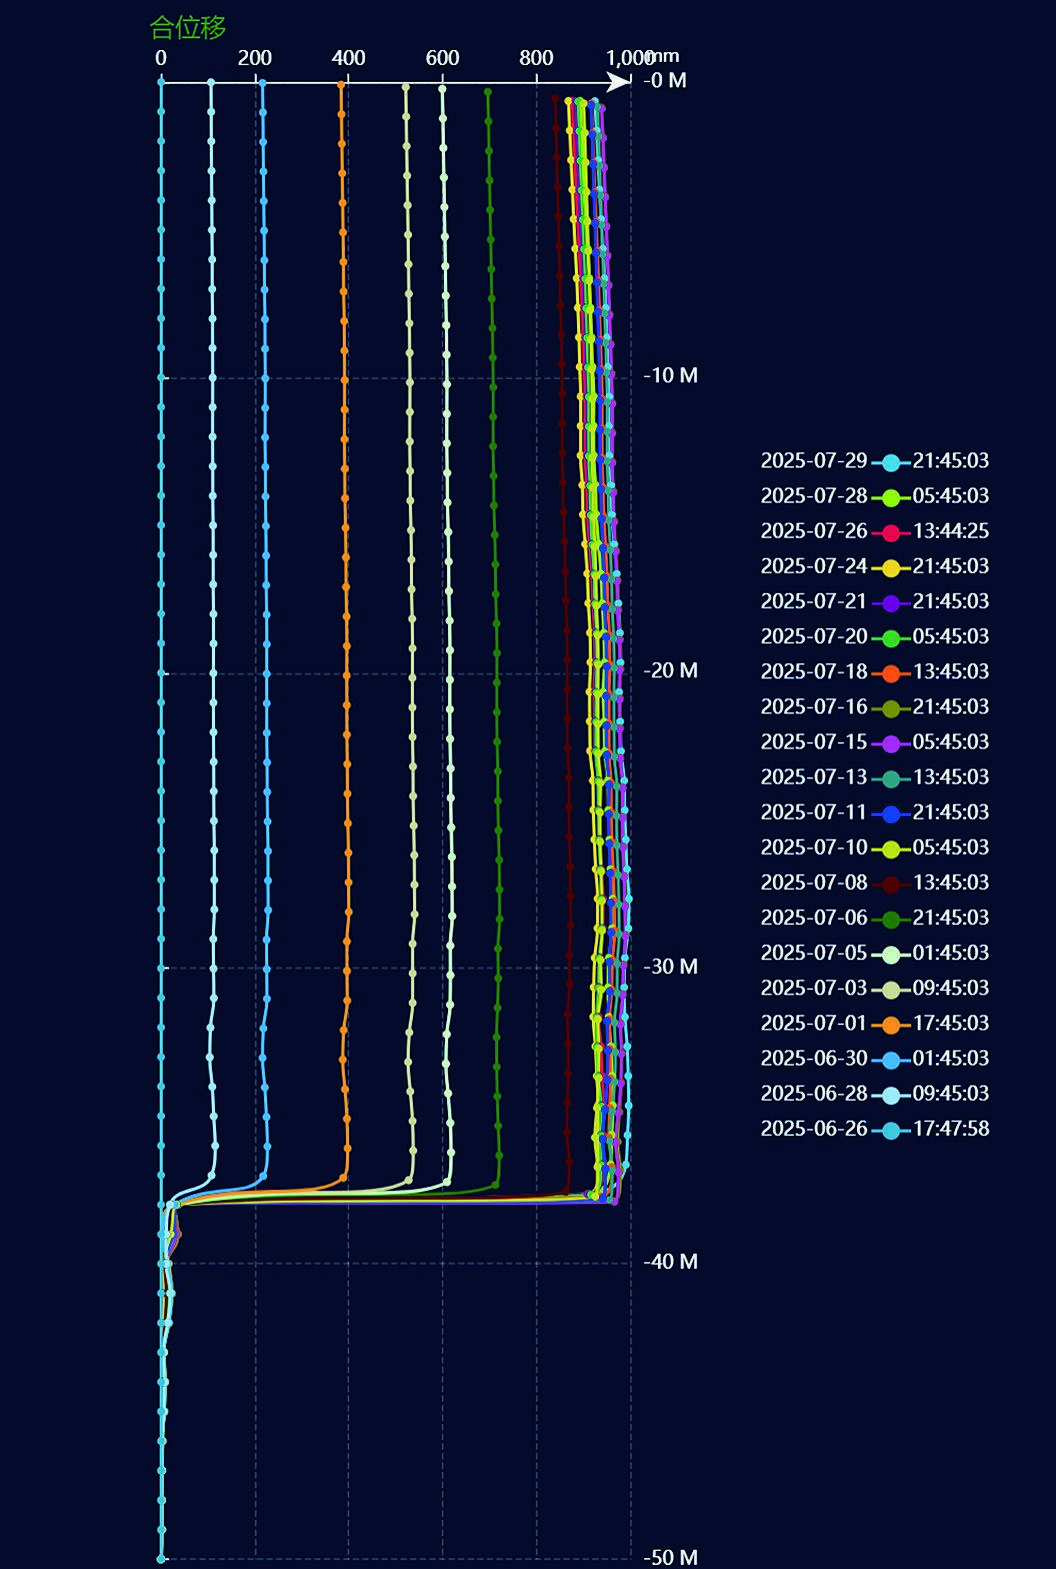
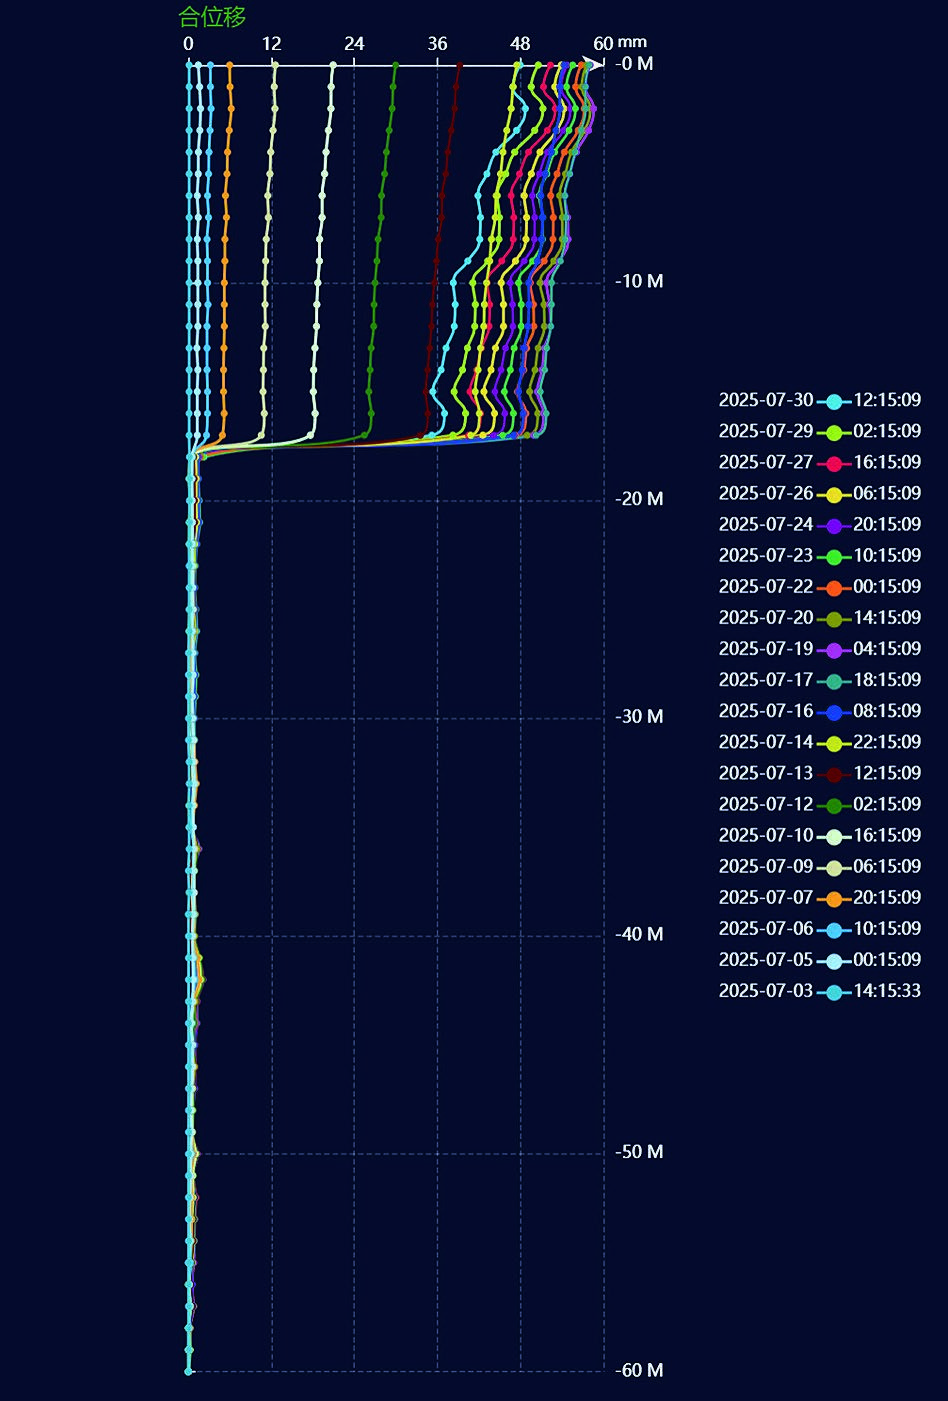
Reviewing GNSS observations alongside borehole profiles helped the team follow both surface movement and deformation at depth during reservoir operation. The records supported assessment of the slope’s response to reservoir regulation.