Background
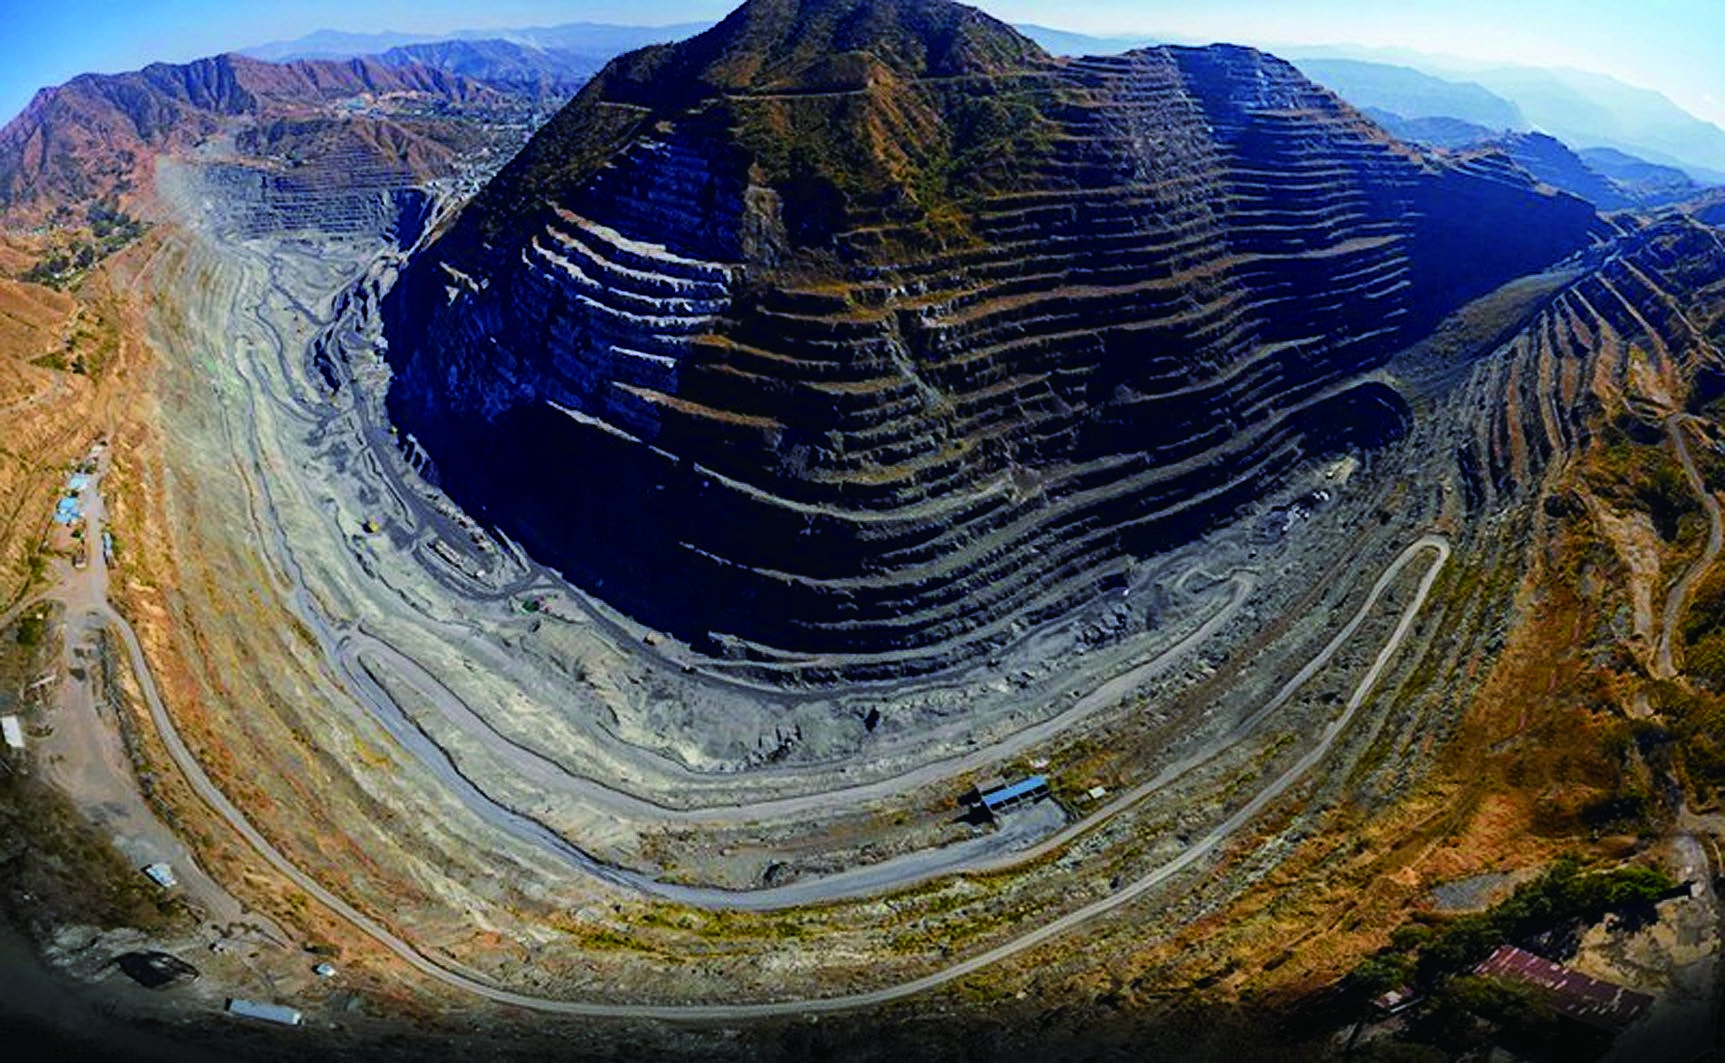
Xichang Vanadium-Titanium Magnetite Mine lies in the Panzhihua–Xichang mineralization region of Sichuan, China, an important source of iron, vanadium and titanium. Its steep, terraced open-pit slopes required monitoring of movement inside the rock mass as well as observations at the surface.
The monitored slopes were more than 100 m high and steeper than 45°. Weak interlayers, cracks, fault zones and potential slip surfaces could influence deformation at depth. Surface observations alone could not establish the location and extent of this movement.
| Project detail | Monitoring record |
|---|---|
| Location | Panzhihua–Xichang region, Sichuan, China |
| Asset | North and south open-pit slopes at Xichang Mine |
| Instruments | RT-1010 Array Displacement Meters |
| Scope | 12 boreholes, averaging 38 m deep; installation began in April 2022 |
| Reported results | After 36 months, a principal deformation zone at 28.5 m and maximum deformation exceeding 700 mm informed earthwork reduction and reinforcement |
Locating the deformation zone
The team needed to locate the principal deformation zone, determine the direction and cumulative magnitude of movement, and follow changes in deformation rate. Measurements along boreholes would inform decisions about excavation and slope reinforcement as mining continued.
Monitoring Solution
Selecting closely spaced displacement profiles
The designers compared portable manual inclinometers, in-place inclinometer arrangements and Array Displacement Meters. Manual surveys required repeated visits to the active mine. Conditions that could change rapidly favored more frequent, automated readings.
Measurement spacing was also a consideration. The in-place arrangements described in this project used intervals of 3–5 m or more. The connected array used 0.5 m or 1 m sections, allowing the team to follow deformation at more closely spaced depths. The selection reflected this project’s measurement objectives and site conditions.
The array could also incorporate a groundwater-level sensor at its lower end where that measurement was required for deformation assessment.
Twelve boreholes across the north and south slopes
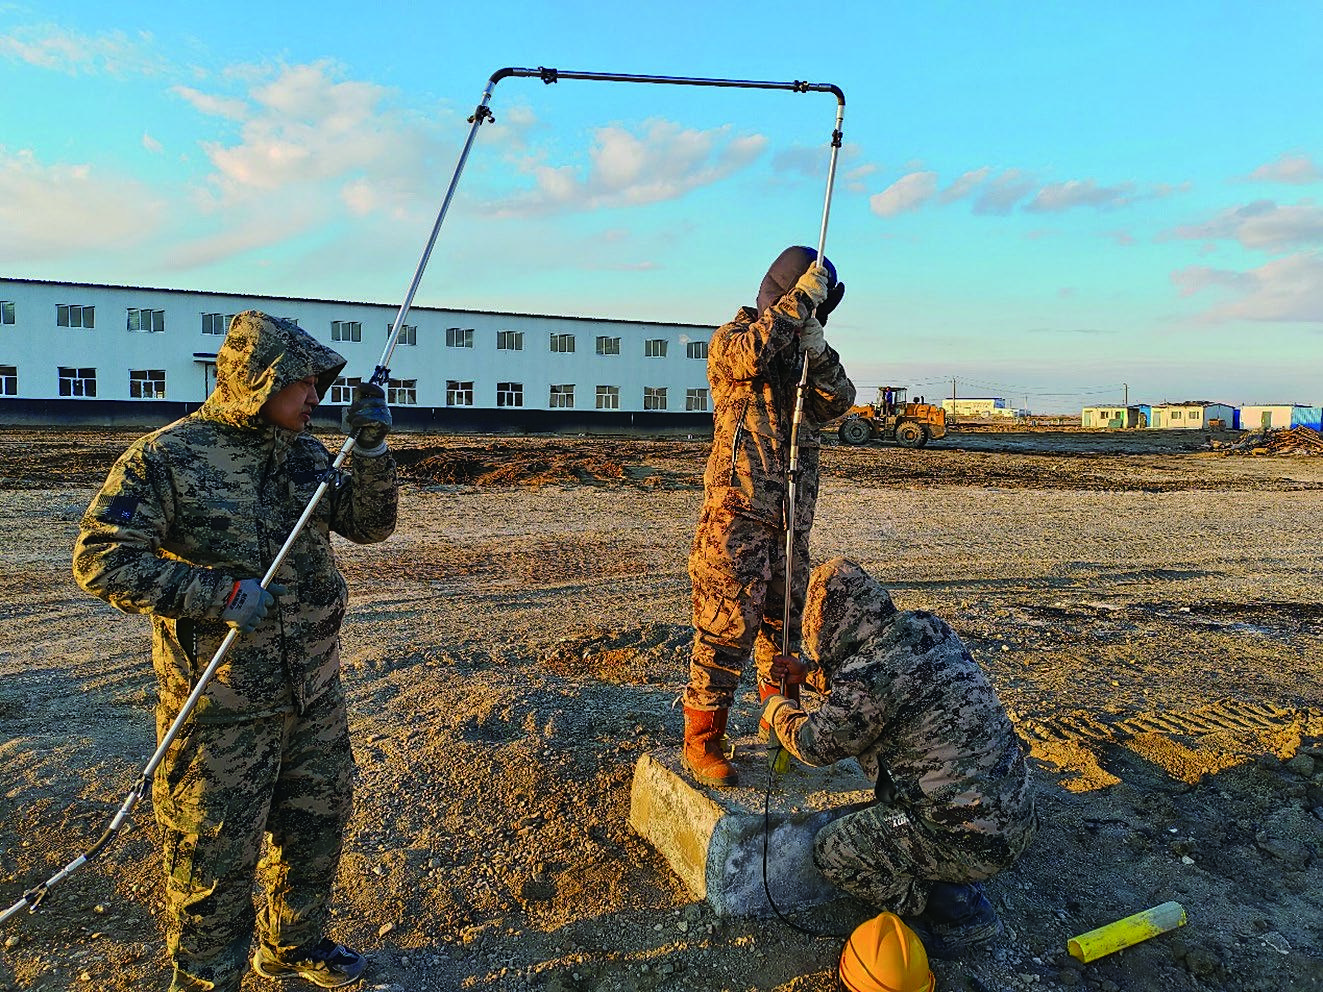
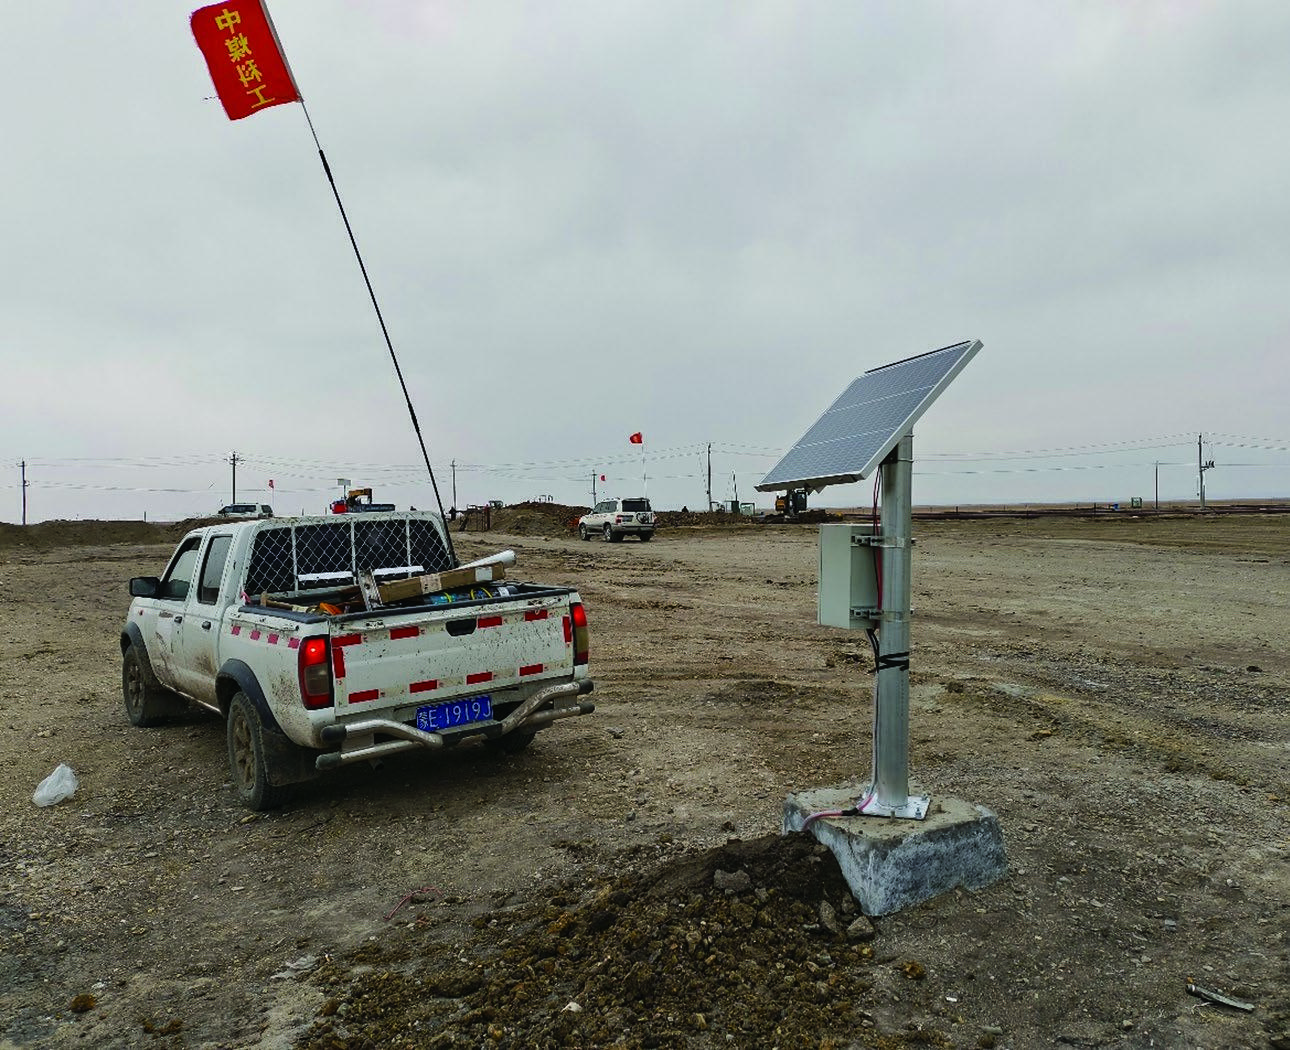
Drilling and installation began in April 2022. The owner’s construction team installed 12 monitoring boreholes across the north and south slopes, with an average depth of 38 m. Connected sensor strings measured displacement along each borehole so that the team could compare profiles from successive dates.
Results
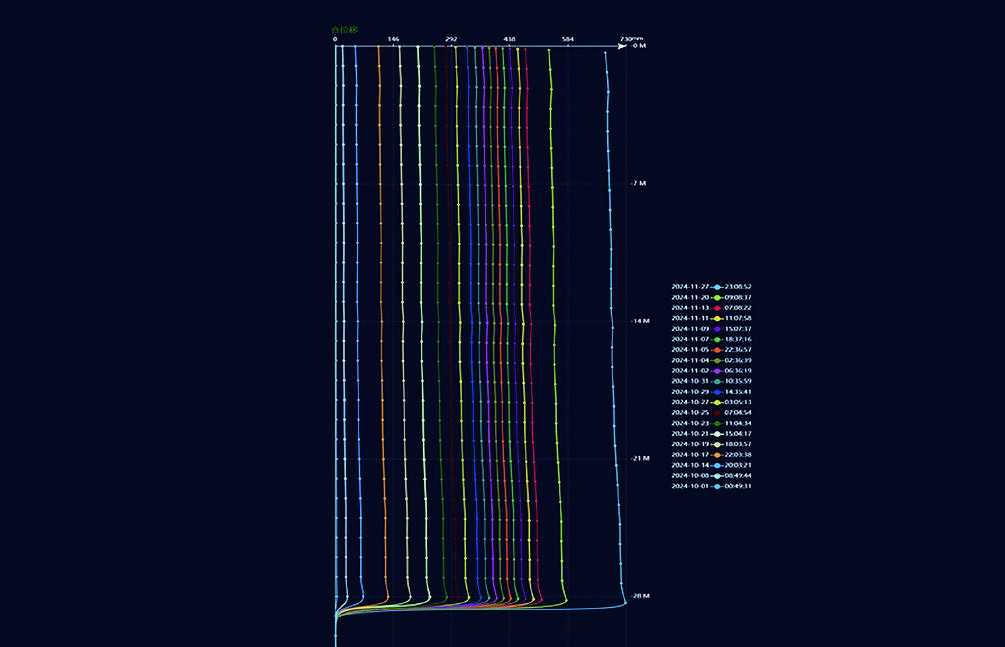
After 36 months of monitoring, the project reported a principal deformation zone 28.5 m below ground level. Maximum deformation exceeded 700 mm, and the estimated sliding mass had a volume of 2,280,000 m³.
When the deformation rate accelerated, mine management reduced earthwork and reinforced the affected areas. The project report states that the rate subsequently decreased and stabilized, with a reduction in slope risk.
The borehole profiles located movement at depth and showed how it progressed, complementing visible surface observations. They informed the engineering response; the subsequent improvement followed earthwork reduction and reinforcement of the affected slope.