
After sustained rainfall, soil moisture at a landslide monitoring site begins to rise and displacement accelerates. The project team needs to establish where the change is occurring, whether it is sustained, what supports an alert and whether the responsible people have received it.
The SINOMACRO Safety Monitoring & Early Warning Cloud Platform connects monitoring data, risk assessment, graded warnings and response tracking around these tasks.
This walkthrough follows a simulated 30-day sequence at the Jianshanying landslide site.
This article explains the functional design using demonstration screens. The site scenario, measurements and warning sequence are simulated. Deployment depends on the installed equipment, available data and project response plan. Figures retain the original Chinese interface labels.
1. Locate the site that needs attention
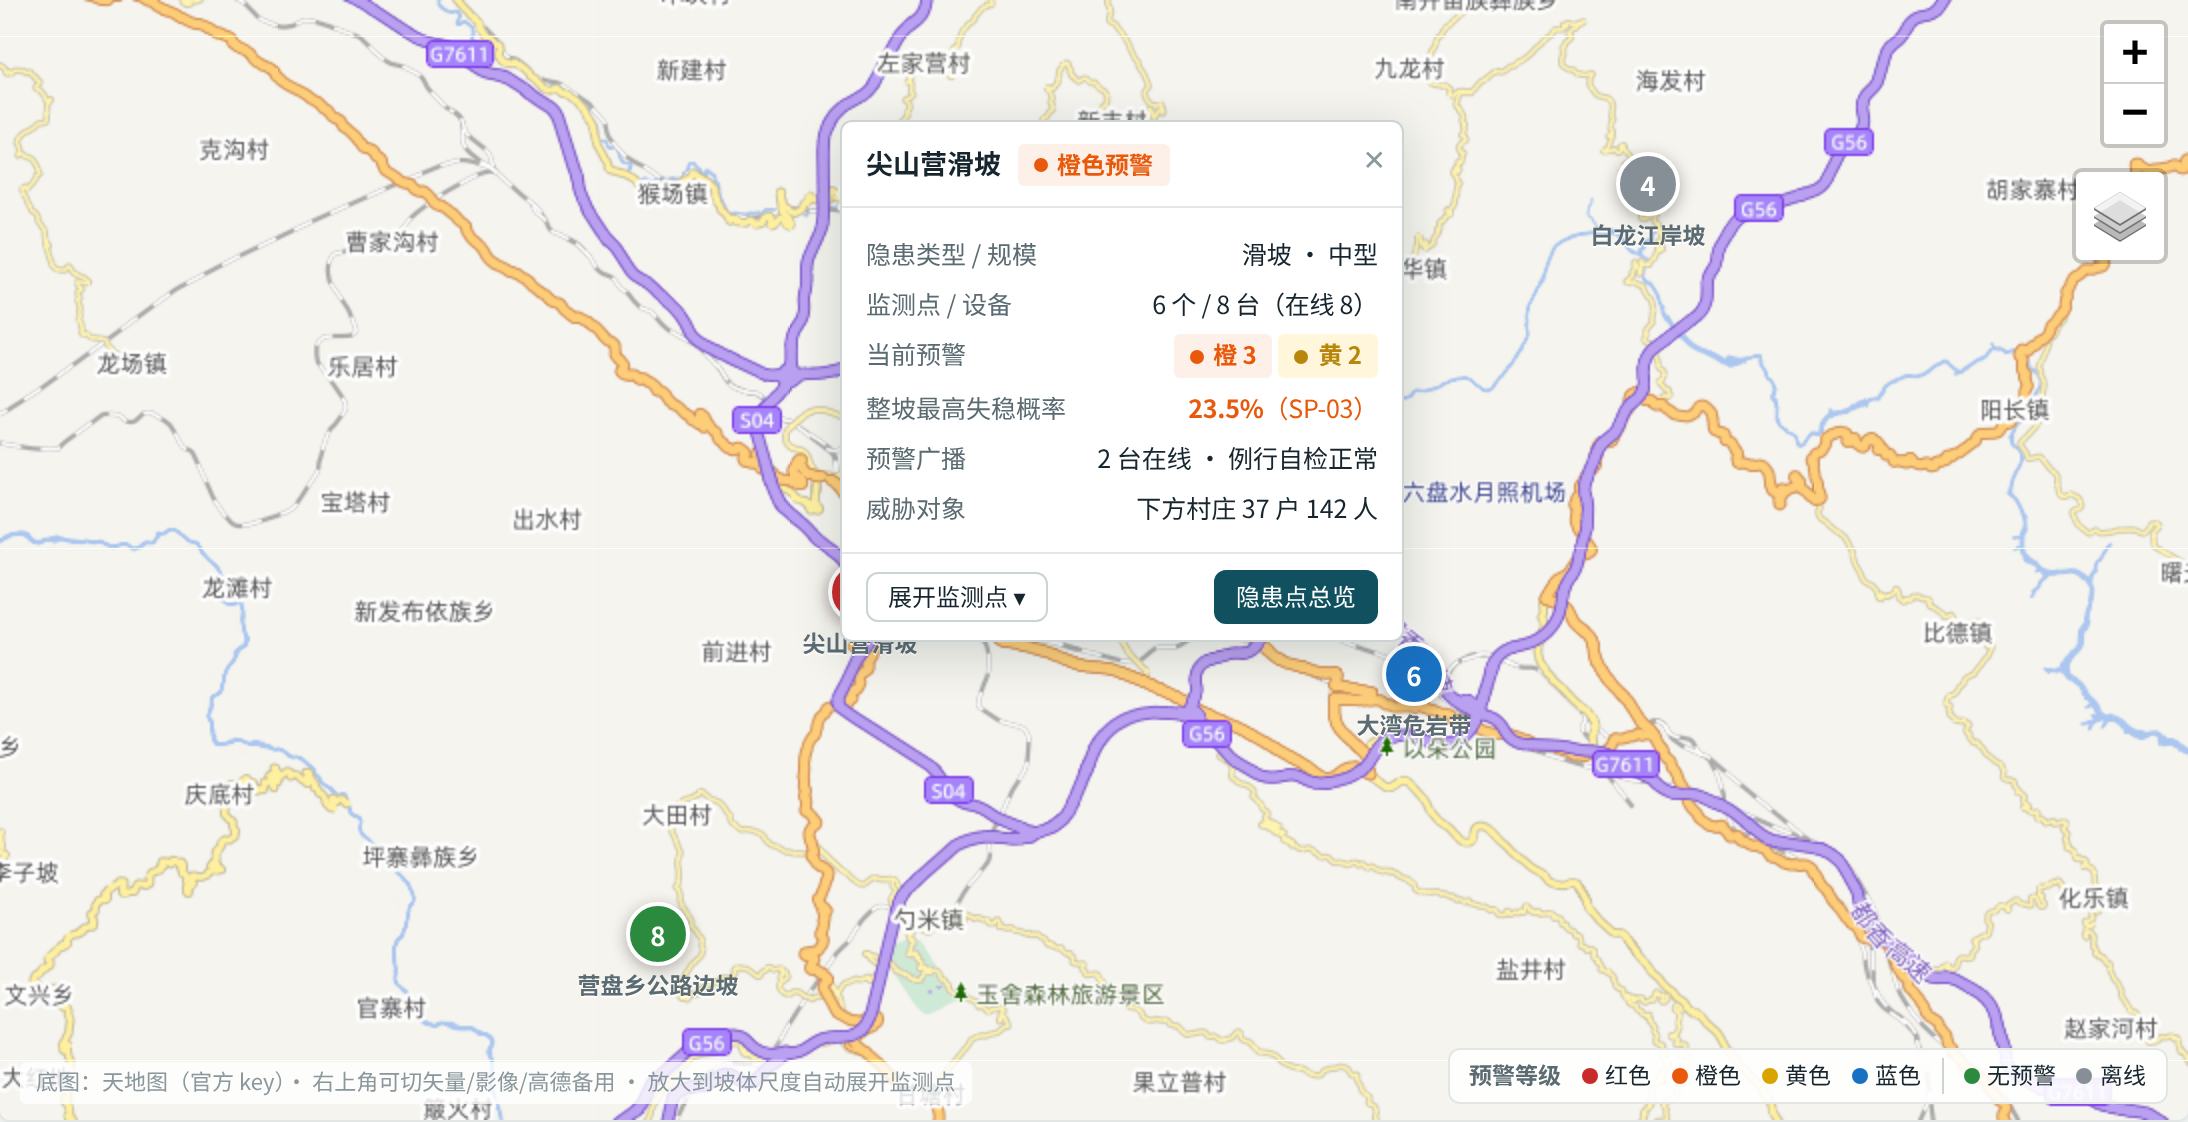
The monitoring overview shows the distribution of sites and their current alert states. In this scenario, Jianshanying is orange. Opening its map marker shows the hazard type, monitoring points, device counts, online status and exposed assets nearby.
Users can then move from the site overview to a particular monitoring point and its measurements. Managers see the project status, operators identify locations requiring attention, and technical staff examine the corresponding devices and data.
2. Compare measurements on a common timeline
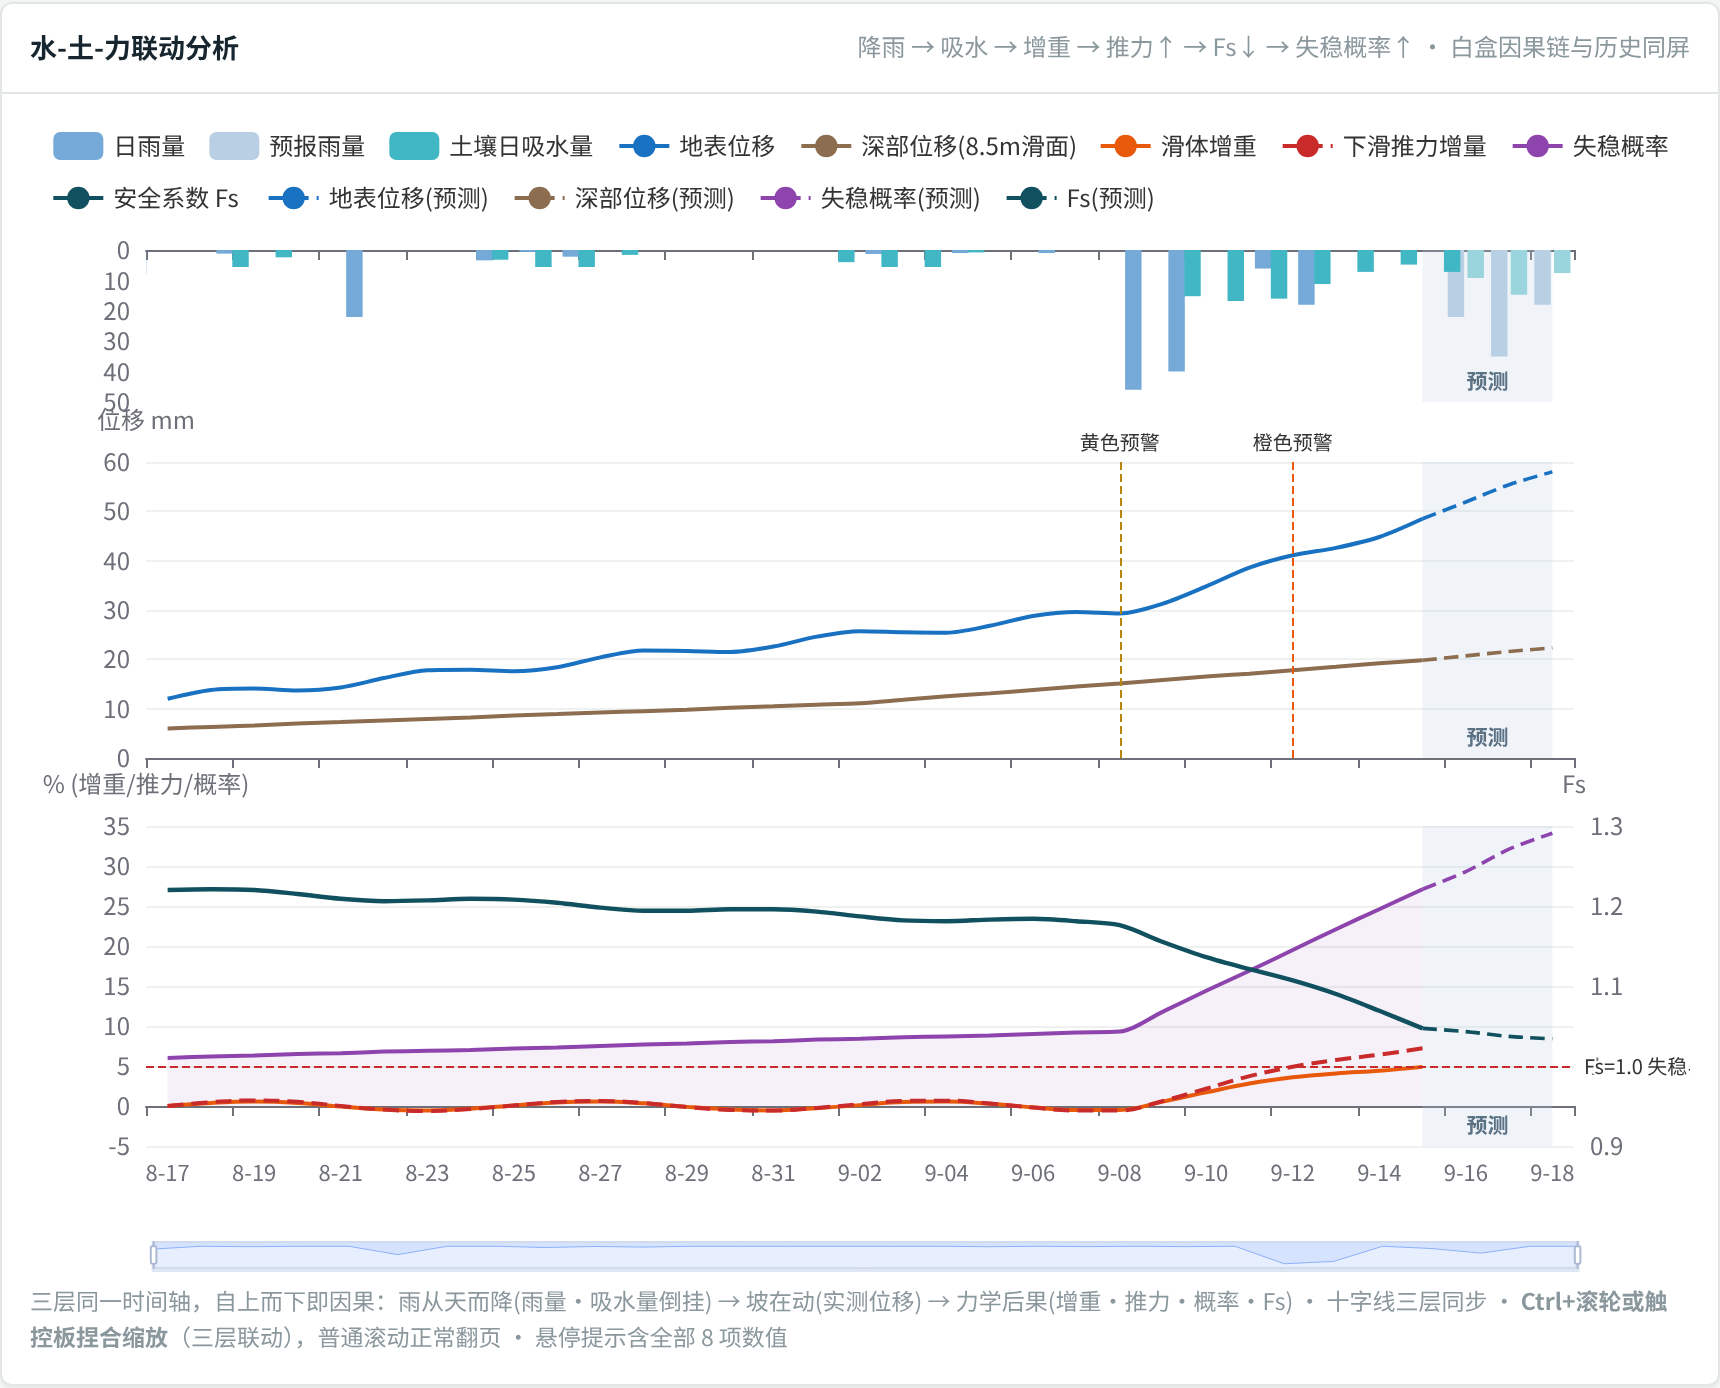
Early in the scenario, rainfall briefly increases soil moisture, which subsequently falls, without clear acceleration in displacement. The configured warning conditions are not met and the platform continues recording.
Later, sustained rainfall is accompanied by persistently higher moisture, accelerating surface displacement and changes at depth that require attention.
Rainfall, moisture, surface displacement and subsurface displacement are placed on the same timeline. This helps the team identify which change appeared first, which indicators responded later and whether the trend is continuing. Depth profiles provide another perspective for comparison with surface observations.
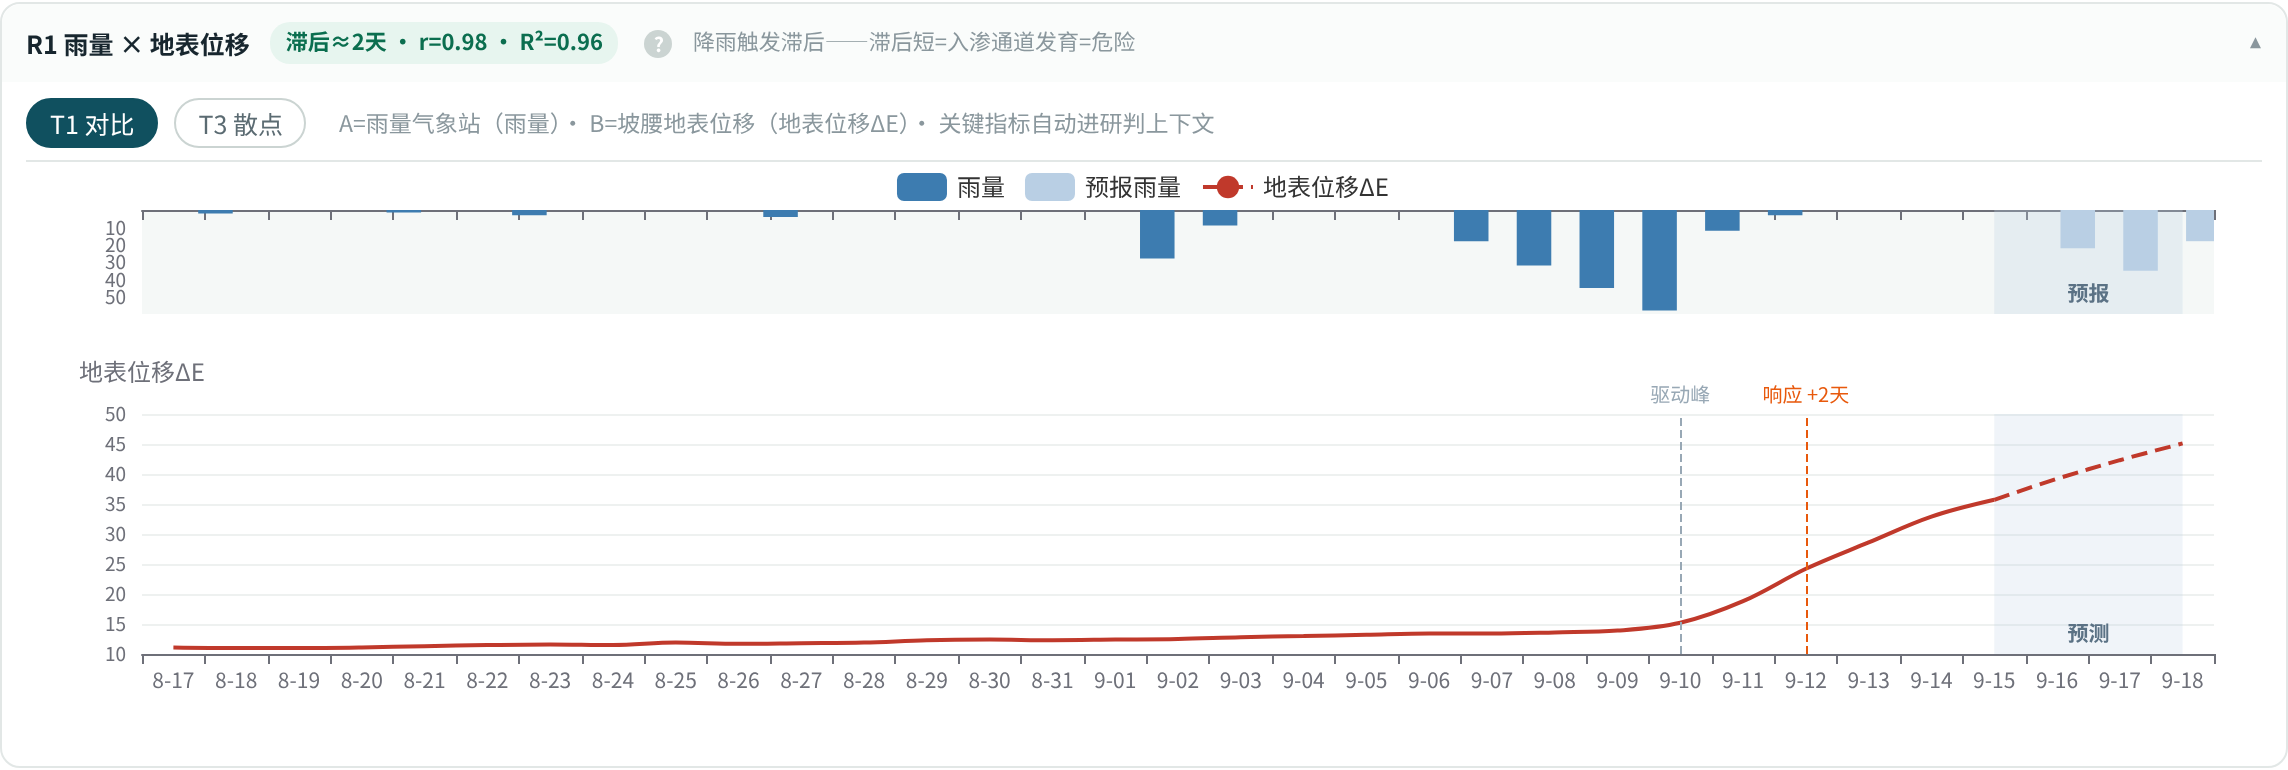
Correlation analysis can pair rainfall with surface or subsurface displacement, or groundwater level with subsurface displacement. The correlation coefficient r, fit statistic R² and time lag help describe relationships. They do not establish causation or independently determine whether a warning is required; the configured trigger conditions still apply.
3. Configure, replay and trace warning rules
As the simulated changes persist, the alert progresses from yellow to orange. The transition is tied to monitored conditions, their duration and the configured rules.
Six types of conditions
| Condition | What it checks | Example configuration |
|---|---|---|
| Value threshold | Whether a reading crosses an upper or lower bound | Compare moisture, water level or tilt with project limits |
| Change over a window | Accumulated change during a defined period | Displacement or crack-opening increment |
| Rate of change | How quickly a measurement changes | Calculate over 1 h, 6 h or 24 h windows |
| Persistence | Whether an abnormal condition continues | Consecutive packets, observation windows or duration |
| Combined conditions | Whether several conditions are met | Combine displacement, moisture and water level using AND/OR |
| Rainfall intensity–duration | How long elevated rainfall continues | Use measured rainfall intensity and duration |
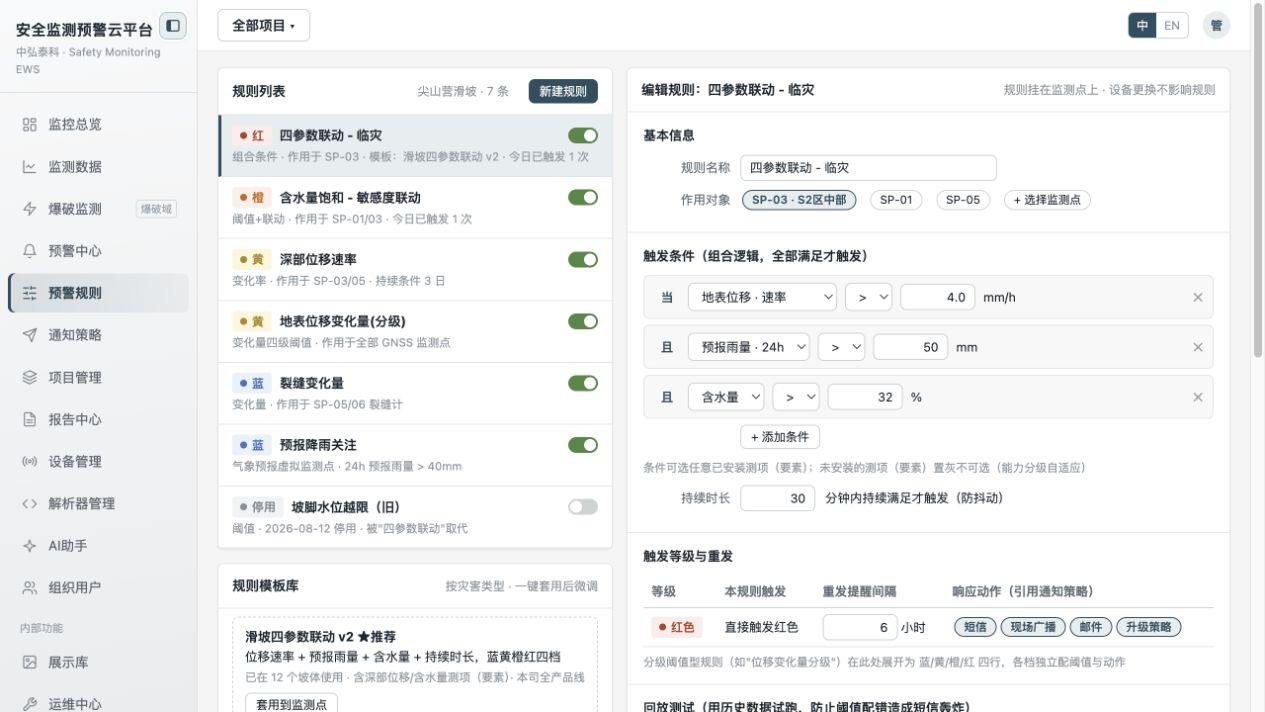
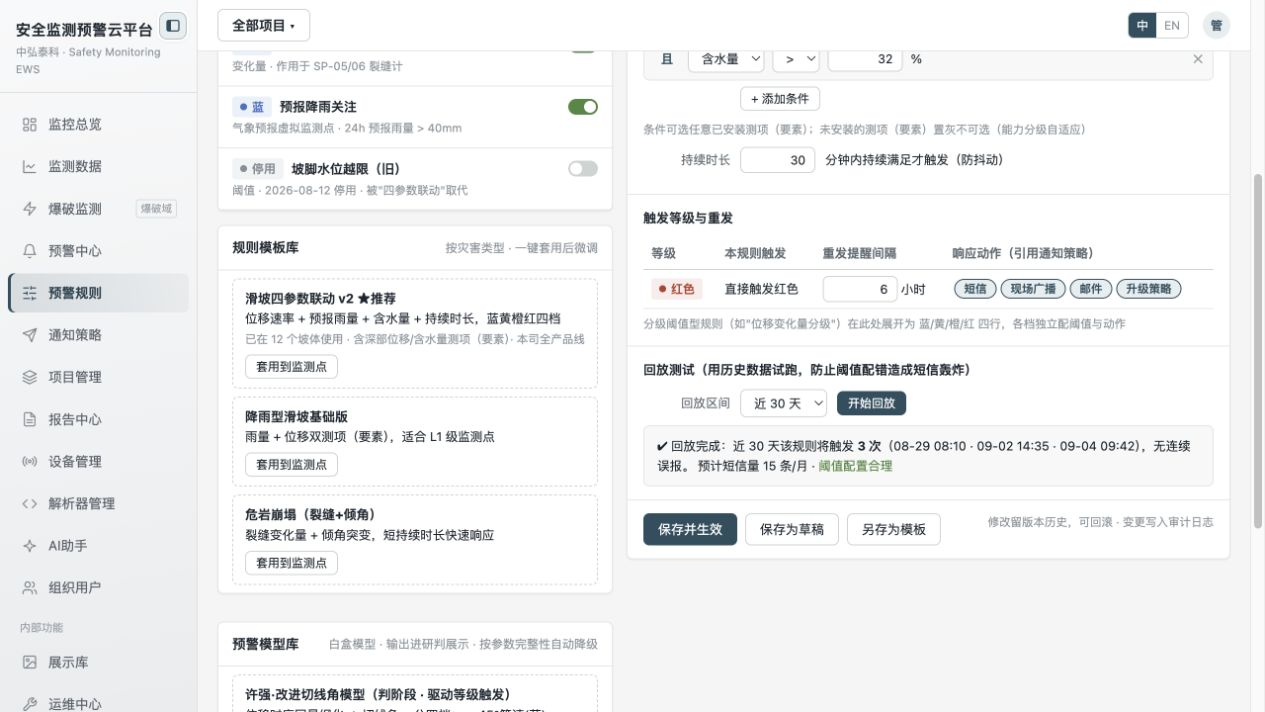
A rule might combine a moisture threshold, a displacement-rate threshold and a persistence requirement, then assign a blue, yellow, orange or red warning and notification actions. Thresholds and durations must reflect site conditions, historical data and the project response plan.
The rule configuration connects monitoring points, metrics and units, comparisons, combined conditions, duration, alert grade, repeat interval and notification strategy. Rules are associated with monitoring points so their relationships can be maintained when a device is replaced.
Templates and historical replay
Templates cover multi-parameter landslide monitoring, rainfall-induced landslides and unstable rock. They provide starting points that must be adjusted to the measurements actually installed and the project thresholds and durations.
Historical replay runs a proposed rule against a selected data period to inspect trigger counts, timing and notification volume. Version records support review and rollback. Replay counts and usage figures shown in the screen are demonstration values.
Forecast rainfall, regional reference rainfall and measurements at the site must have clear source labels. Weather information provides additional context; gridded estimates must not be treated as direct site measurements.
Check data availability before using a model
The model library identifies each method’s purpose, parameter completeness and availability. For example, Saito analysis remains unavailable when the accelerating segment is insufficient. The screen’s requirement of at least seven days of continuous acceleration is a demonstration setting, not a universal standard.
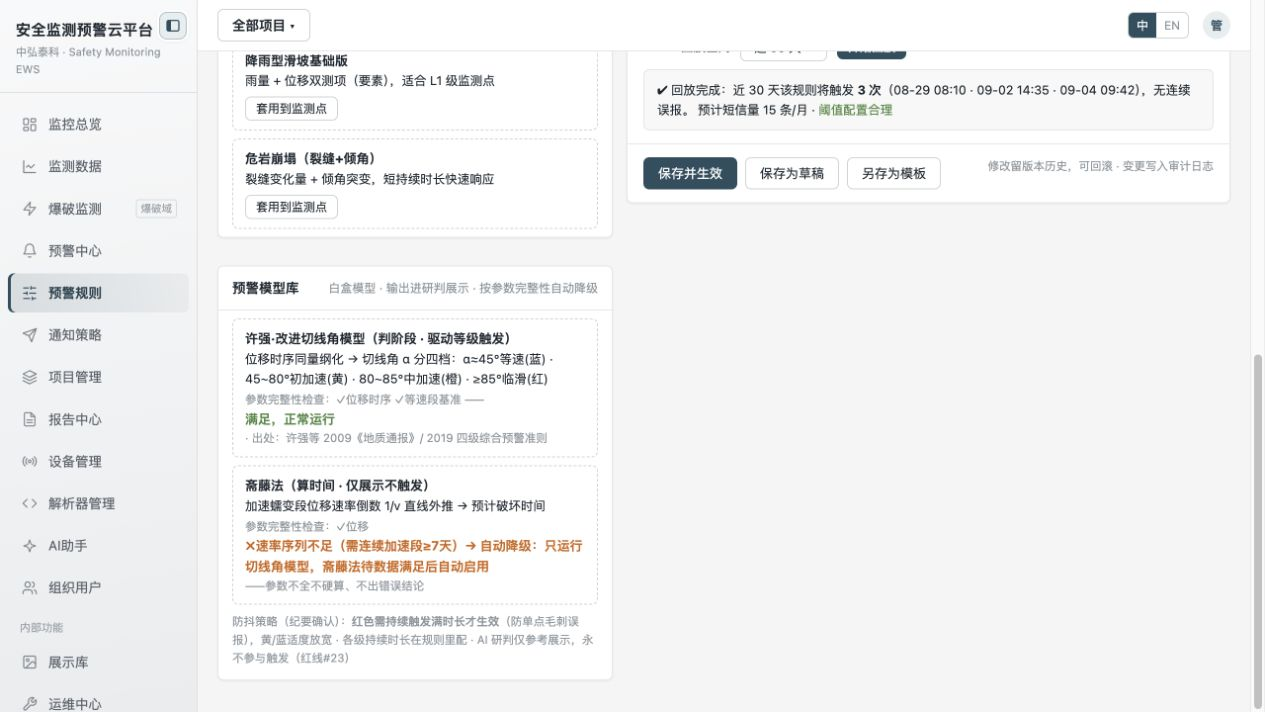
The objective is to make conditions configurable, triggering reviewable and changes traceable.
4. Explain how the analysis contributes
Calculate rates using the real time interval
The design calculates displacement rate as v = (current displacement − previous displacement) / actual elapsed time. Routine reports and extra event reports may arrive at different intervals, so timestamps and consistent units matter.
Missing readings, isolated spikes, device status and data validity must be checked before model input. A single anomalous reading should not automatically be interpreted as sustained deformation.
Improved tangent angle
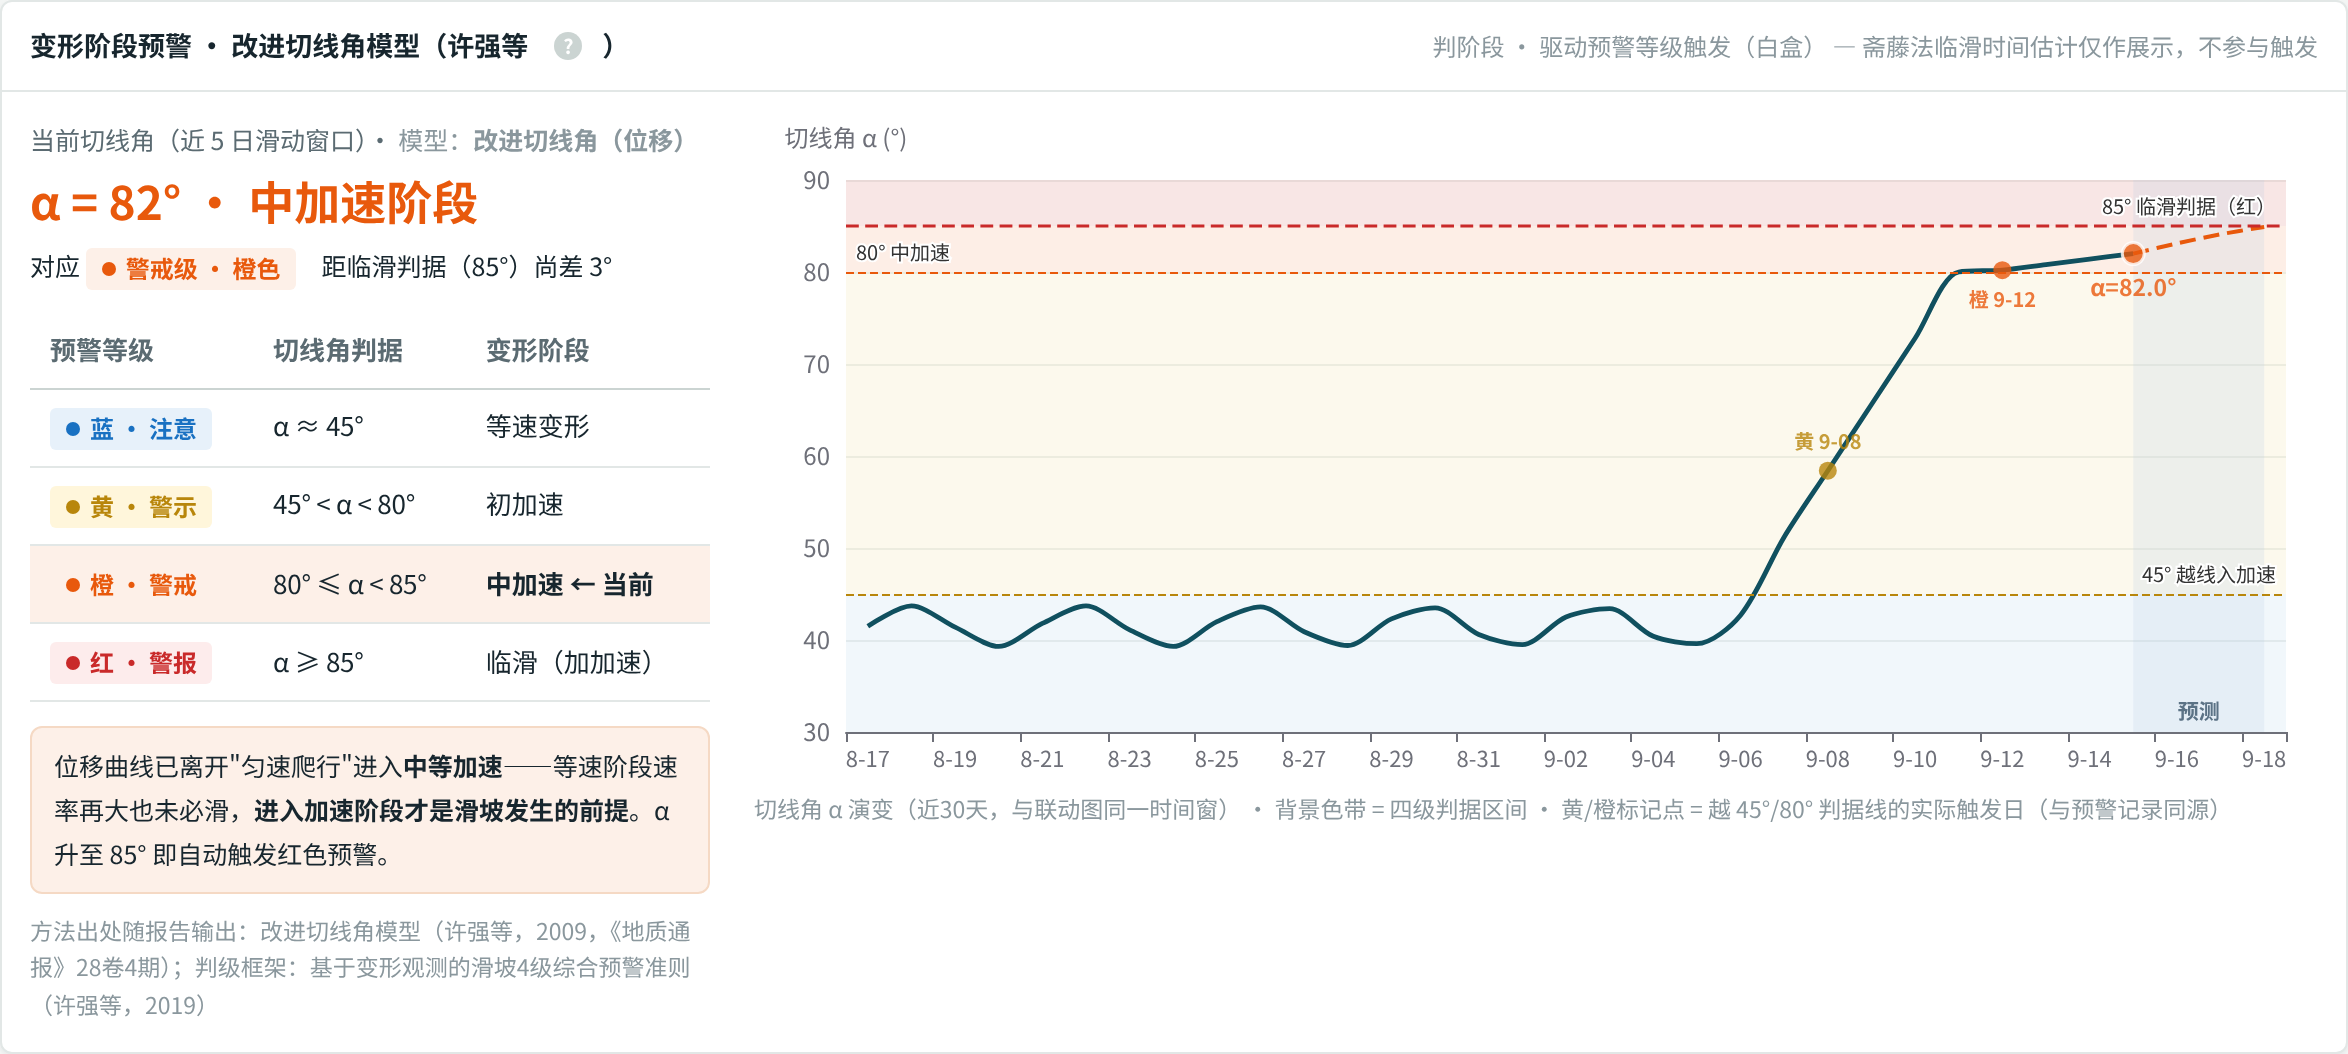
The method normalizes the displacement–time relationship. An approximately constant-rate segment supplies a reference rate v₀; cumulative displacement S is converted to T = S / v₀, then α = arctan(ΔT / Δt). For a common calculation window, this can be understood as comparing the current rate with the reference rate.
The source is the improved tangent-angle study by Xu et al.. The demonstration uses these stages:
| Improved tangent angle α | Demonstration stage | Demonstration grade |
|---|---|---|
| Approximately 45° | Constant-rate deformation | Blue: attention |
| 45° < α < 80° | Initial acceleration | Yellow: caution |
| 80° ≤ α < 85° | Intermediate acceleration | Orange: warning |
| α ≥ 85° | Increasing acceleration / approaching failure | Red: alarm |
These intervals explain the model and the demonstration grades. Site use requires checking the deformation mechanism, reference segment, calculation window and response plan. The thresholds cannot be applied without their conditions. See also the study of Xinhua landslide deformation and warning criteria.
Saito and inverse velocity: supporting time-trend assessment
Saito analysis estimates a possible failure time from accelerating creep. Inverse velocity (INV) examines 1/v against time. Where the relevant acceleration behaviour supports an approximately linear inverse-velocity trend, 1/v = a·t + b gives an extrapolated intercept t_f = −b/a.
The estimate depends on data quality, fitting window and site conditions. It should be updated as observations arrive and expressed as a time range. See Carlà et al.’s application guidance for processing and limitations.
In the platform design, explicit rules and improved tangent angle contribute to warning-grade decisions. Saito and the planned INV analysis support technical assessment. AI explains information and helps assemble reports. These supporting tools do not directly determine the warning grade.
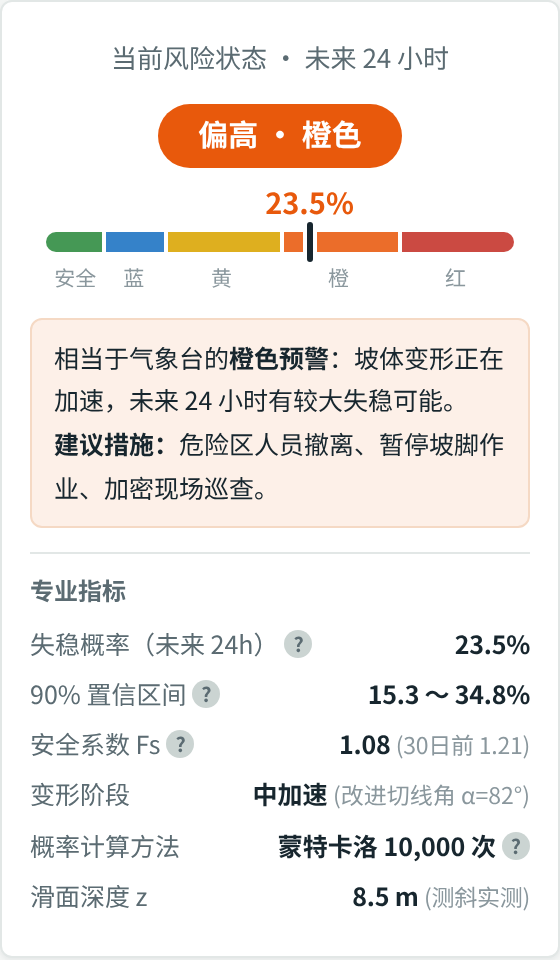
Stability and uncertainty
With sufficient geological and monitoring data, the design uses an infinite-slope model to examine factor of safety Fs. Inputs include effective cohesion, friction angle, slope angle, slip-surface depth, soil unit weight and pore-water pressure.
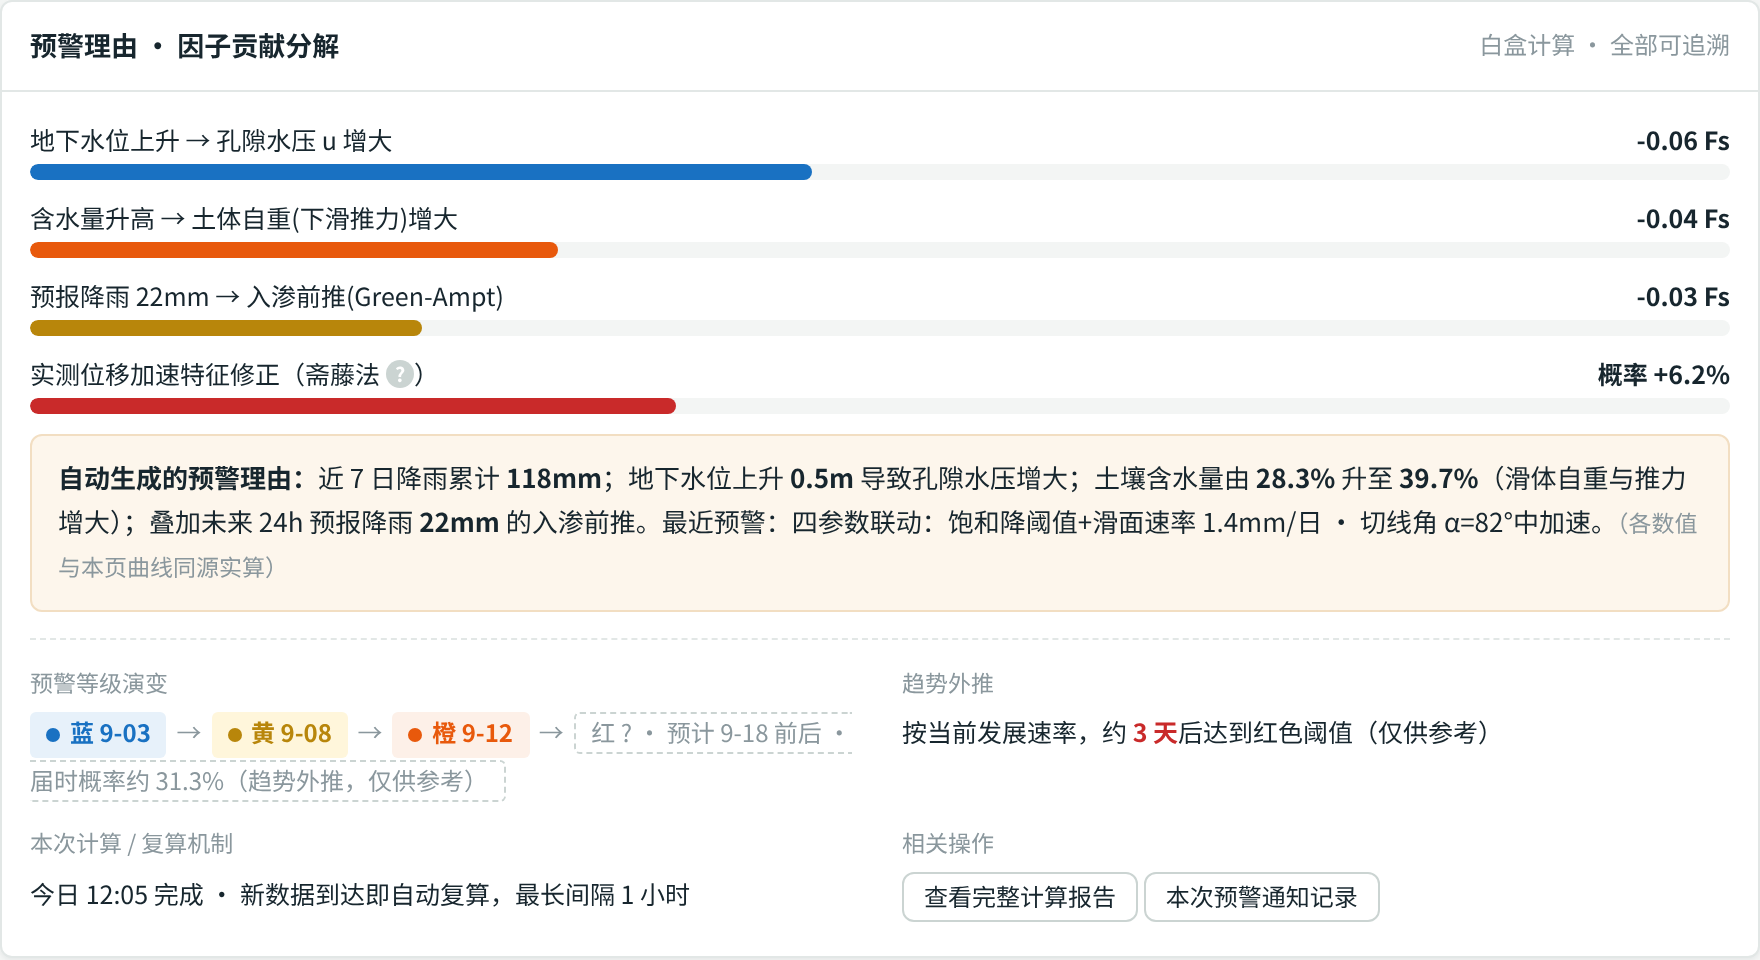
Monte Carlo sampling explores the Fs values produced by specified input distributions. The number of samples with Fs < 1 divided by the total sample count describes an instability fraction within that model and its assumptions. Sampling alone does not establish the probability of a landslide in the next 24 hours. A time-specific prediction also requires time-varying inputs and field validation.
Correlation and trend projection
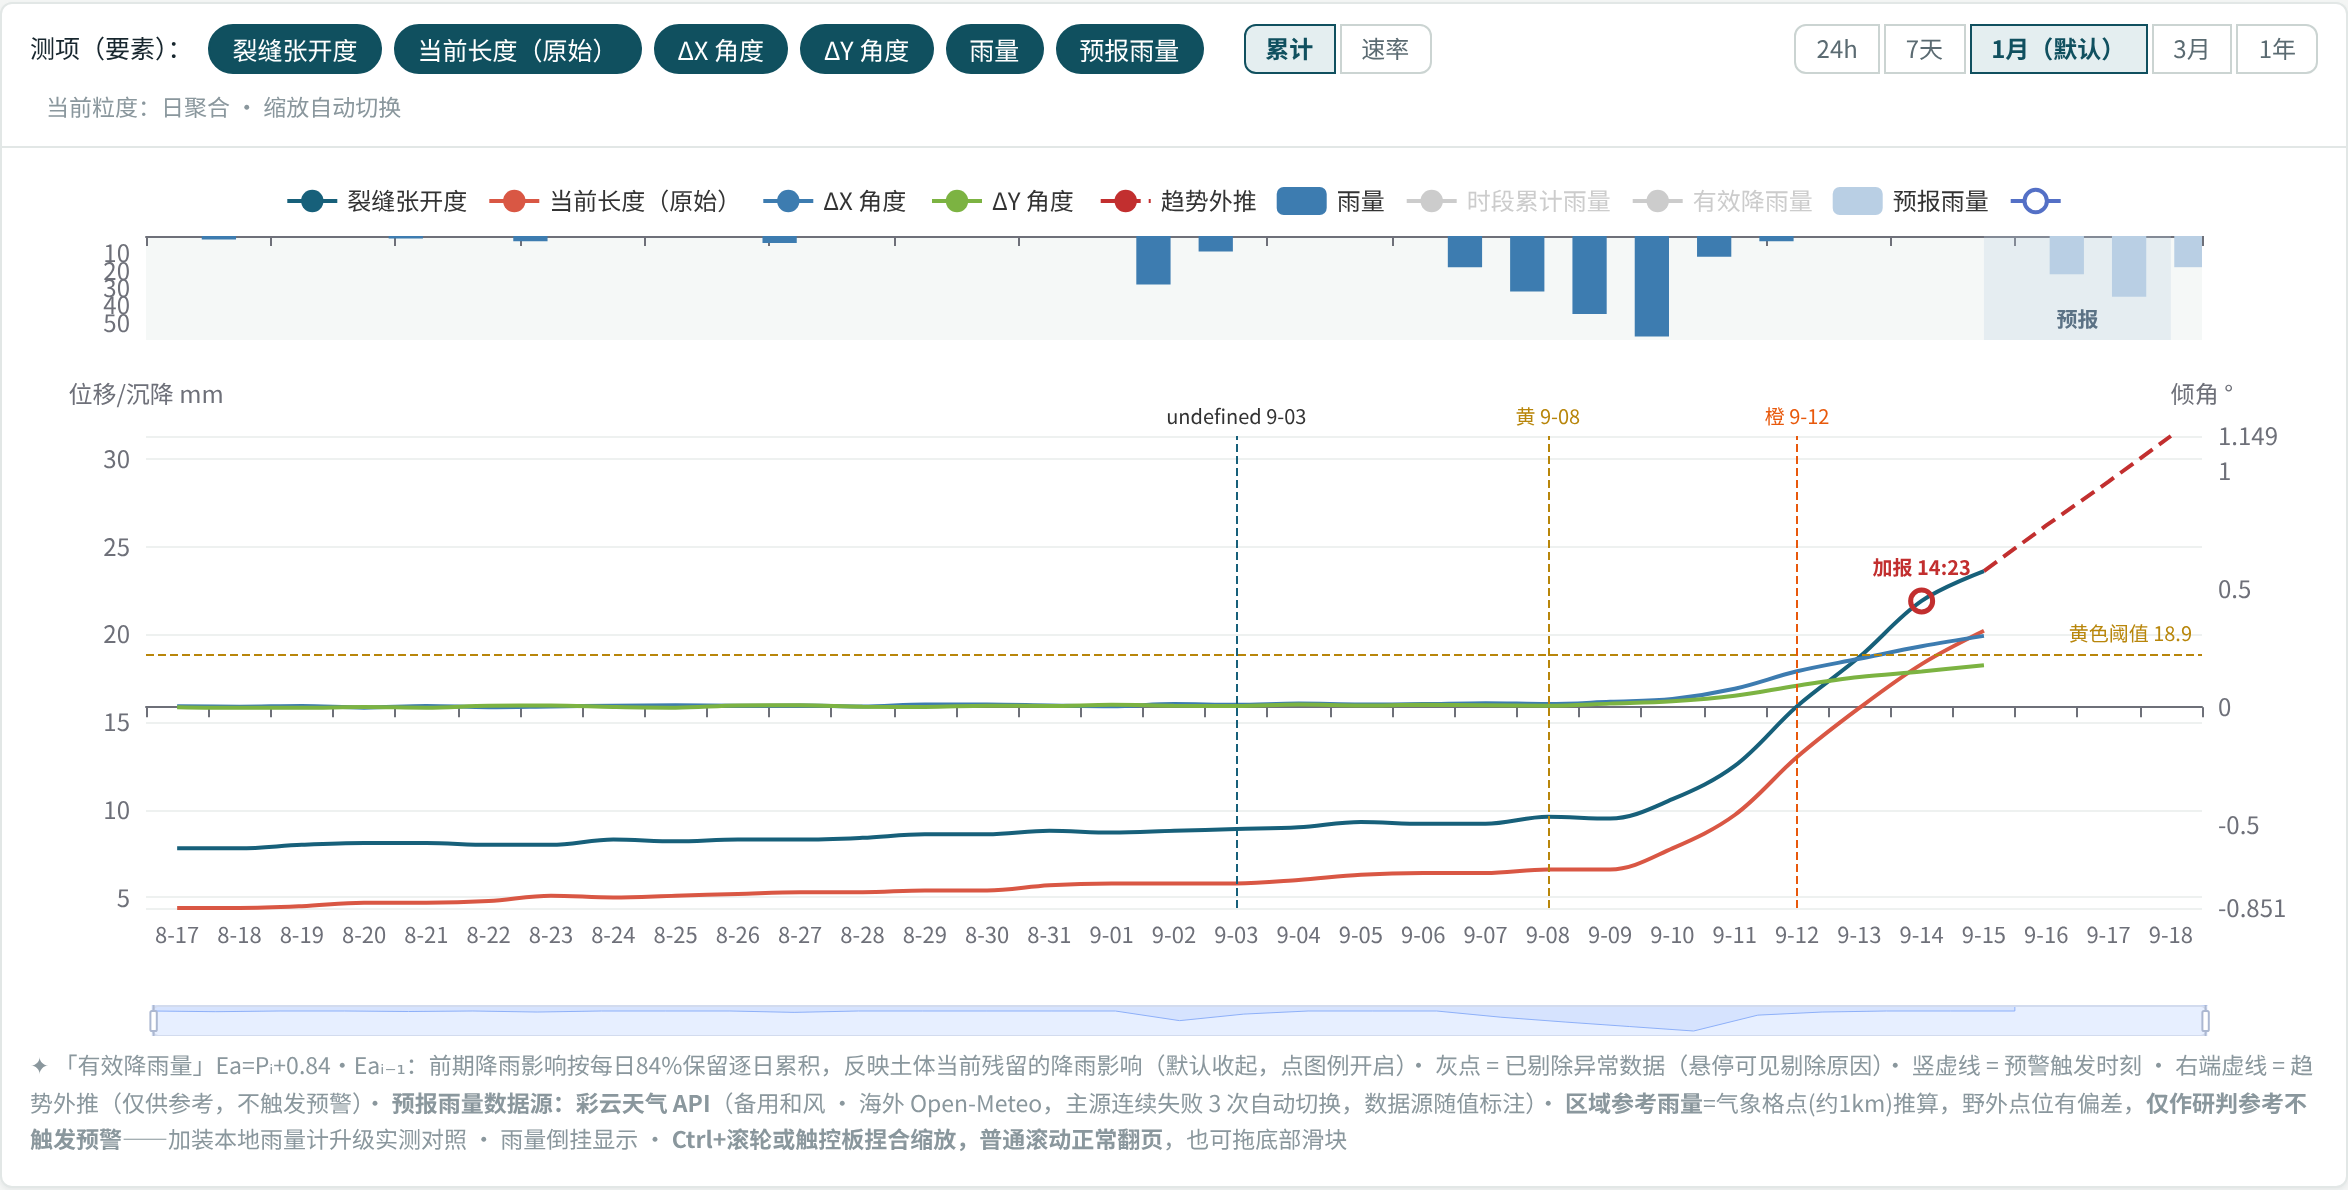
Effective rainfall and correlations at different lags help explore how long a response follows rainfall. The design uses Eₜ = Pₜ + k·Eₜ₋₁, where Pₜ is rainfall in the current interval and k is a configurable decay coefficient.
Further assessment may combine forecast rainfall, simplified infiltration and water-balance calculations, and displacement extrapolation. Forecast regions and dashed lines distinguish these from observations; estimates are updated with new data.
A warning should make its basis understandable: where a change occurred, which conditions were met and which observations support it.
5. Capture changes between routine reports
Crackmeters and other devices with on-device event-reporting capability can send additional data when configured conditions are met. The mechanism and latency depend on the model and communication conditions.
The interface places these events alongside routine readings and warning times, helping the team review the sequence. Historical measurements, forecast rainfall and extrapolated trends remain distinct.
These observations support site checks, inspection and emergency preparation. Actual response actions depend on field conditions and the project plan.
6. Follow the warning through to response
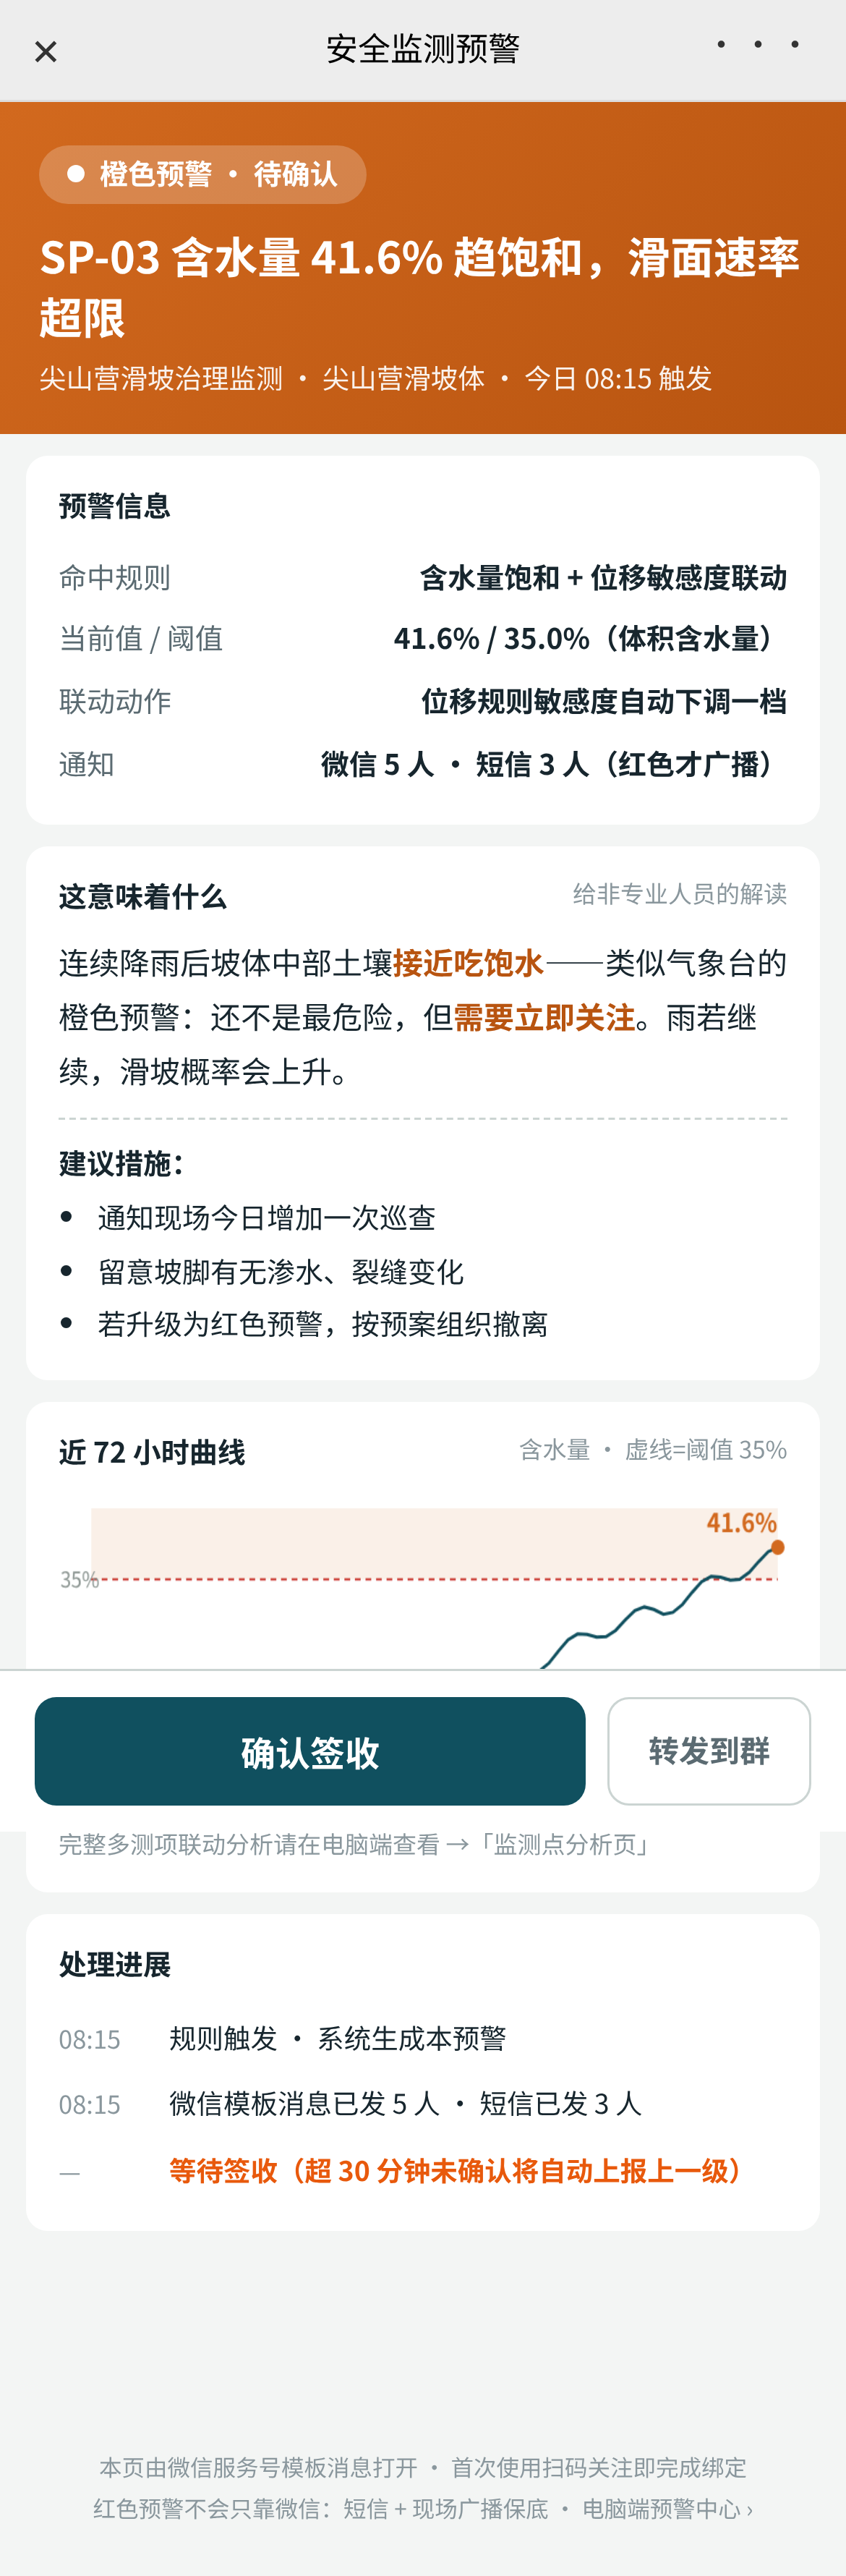
The demonstration mobile page lets responsible staff view location, grade, trigger reason and points requiring attention, then acknowledge receipt.
The workflow design assigns recipients and channels by grade, records delivery and acknowledgement status, and tracks progress. If acknowledgement is overdue, repeat reminders or escalation can be configured. Where field broadcast equipment is installed, its notification and equipment receipt status can also be tracked.
The warning timeline brings together:
- The trigger time and supporting evidence;
- Recipients and delivery status;
- The person who acknowledged the warning;
- Response progress and the review required before closure.
7. Match analysis to the data available
Some sites focus on rainfall and surface movement. Others also measure subsurface displacement, soil moisture, groundwater level and cracks. The available measurements determine which analyses can be supported.
The platform organizes data displays, rules and correlations around connected measurements. Stability analysis additionally requires suitable geological information and model parameters. Where information is insufficient, the design indicates what is missing rather than presenting an unsupported result.
8. Technical references and their roles
Standards address monitoring practice, data organization, communications and equipment testing. Research supplies analysis methods; the project determines applicable thresholds, parameters and response procedures. Check the applicable editions and scope before project use.
Standards cited in the Chinese source
- DZ/T 0460—2023, automated instrument monitoring and early warning for geological hazards: a reference for monitoring practice. Effective 1 January 2024. Official record.
- DZ/T 0442—2023, database construction for geological-hazard monitoring and early warning: a reference for data organization. Effective 1 November 2023. Official record.
- DZ/T 0450—2023, technical requirements for geological-hazard monitoring data communications: a reference for integration. Effective 1 January 2024. Official record.
- DZ/T 0439—2023, testing requirements for geological-hazard monitoring and early-warning equipment: a reference for equipment testing. Effective 1 August 2023. Official record.
The descriptions above are English summaries of the Chinese titles. References do not establish project conformity. Earlier project materials also referenced a draft specification for general-purpose instrument monitoring; that draft retains its original status and should not be substituted for a verified published edition.
Research methods
- Xu Qiang, Zeng Yuping, Qian Jiangpeng et al., 2009: improved tangent angle and corresponding landslide-warning criteria, Geological Bulletin of China, 28(4), 501–505. DOI.
- Xu Qiang, Dong Xiujun and Li Weile, 2019: integrated space–air–ground identification, monitoring and warning of major geological hazards, Geomatics and Information Science of Wuhan University, 44(7), 957–966. Journal article.
- Saito (1969), tertiary creep and failure-time prediction, and Fukuzono (1985), inverse-velocity analysis: see the method history and references in the following guide.
- Carlà et al., 2017: guidelines for inverse-velocity analysis in warning thresholds and landslide or structure-collapse prediction, Landslides, 14, 517–534. Journal article.
The sequence is map location → multi-source monitoring → risk assessment → graded warning → notification and acknowledgement → response tracking. Each role can follow the same warning while carrying out its own responsibilities.
Contact us by telephone or email to discuss a demonstration and the monitoring configuration for your project.