
The site assessment indicates downslope movement, but the displacement curve shows negative values. Before concluding that the equipment is faulty, establish which axis is negative and what the plotted quantity represents: raw tilt, a segment change, or accumulated displacement.
This article considers horizontal displacement relative to an initial monitoring epoch, with the intended +X direction pointing downslope.
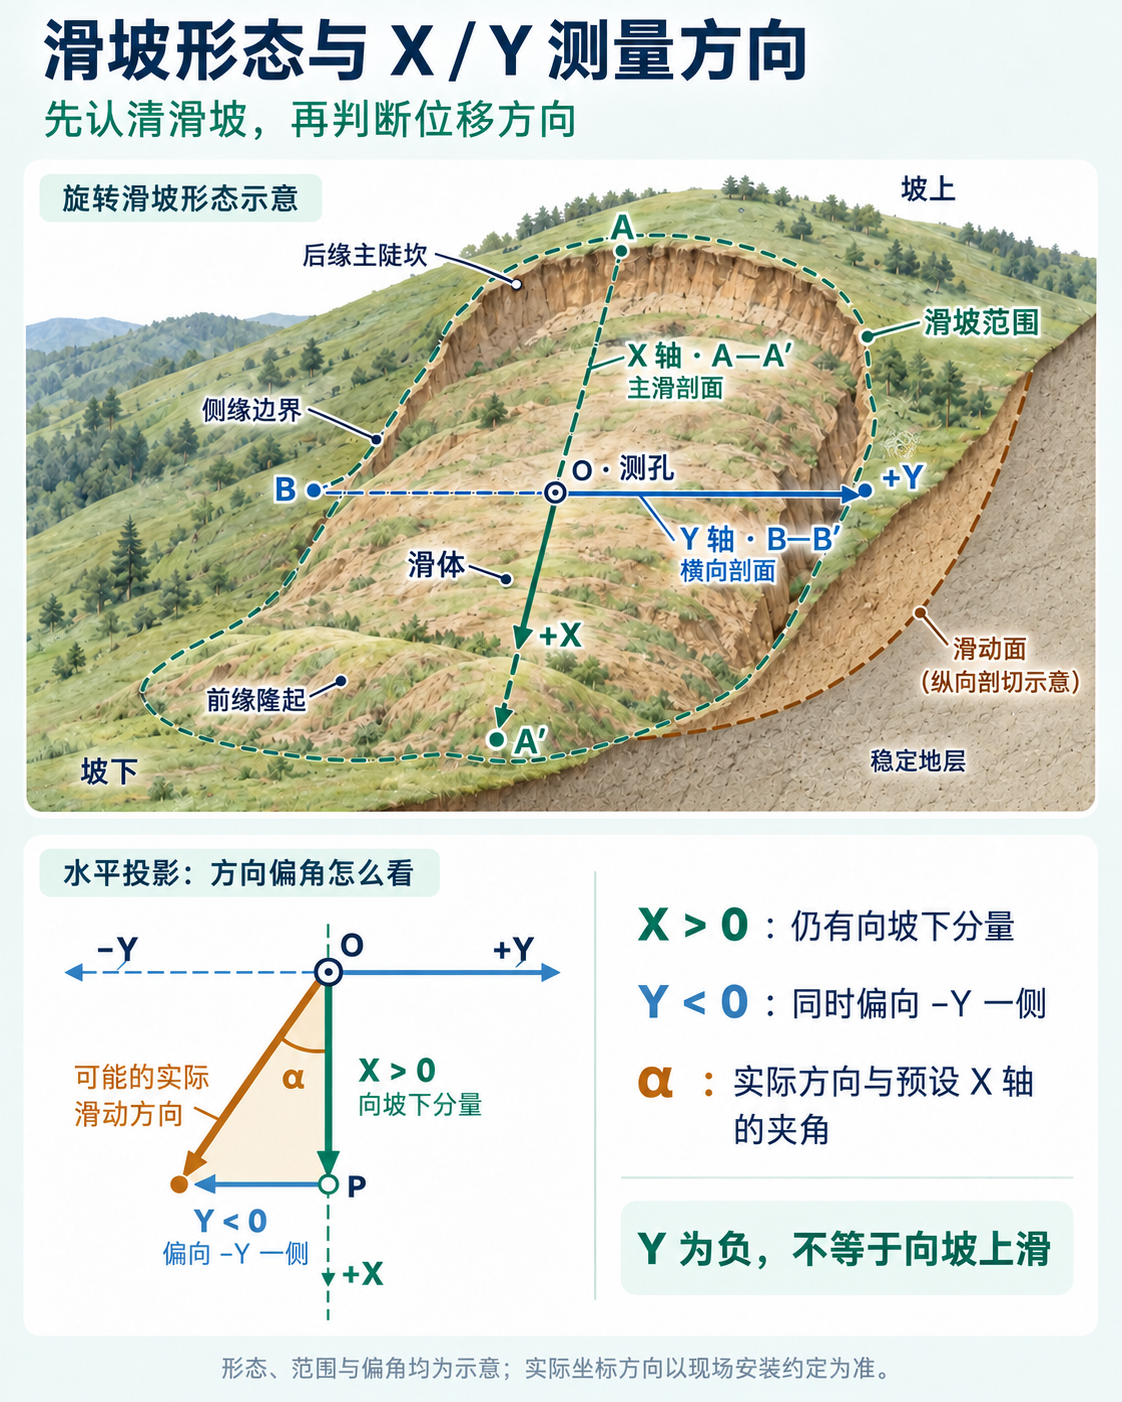
A negative Y value can simply describe direction
The X axis normally represents the principal A–A′ section and Y the transverse B–B′ section. The actual positive directions must follow the site installation convention.
Movement does not necessarily follow the assumed X axis exactly. If it points toward −Y, X can be positive while Y is negative: the movement has both a downslope and a transverse component.
A negative Y value alone neither means upslope movement nor proves a faulty instrument. Assess its magnitude, rate and relationship with readings at other depths. See the DGSI direction guidance for the relationship between axis signs and installation orientation.
If the data must be presented along a verified movement direction, transform both axes consistently. Do not rotate the axes merely to make Y positive.
If X is negative too, check these six possibilities
Use the following as a practical investigation sequence, together with installation records, both measurement axes and independent observations.
1. Configuration or sign conventions
An inconsistency in the X/Y mapping, signs, azimuth parameters or subtraction order between epochs can reverse the displayed change.
Clues: reversal appears after initial integration, a platform change or a parameter update; several sensor segments change similarly at the same time.
Action: compare the physical direction marks, protocol and platform settings. Apply a known-direction test through the complete chain from raw readings to calculation and display. After confirming the convention, recalculate the affected history consistently and retain the configuration-change record.
2. Actual movement differs from the assumed +X direction
Local ground blocks, different depths or different stages of movement may not follow the direction anticipated during installation.
A small direction error may explain negative Y, but it does not by itself turn a displacement along +X into negative X. With reliable coordinates and reference points, a horizontal displacement vector must be more than 90° from +X to have a negative X component.
Clues: the resultant direction from both axes differs substantially from the assumed direction, with supporting evidence from surface surveys, cracks or adjacent boreholes.
Action: reassess the direction using topography, geology and independent displacement observations. Where supported, update the orientation parameter and reprocess relevant history in a common coordinate system. Changing coordinates changes the components, not the physical movement.
3. Backfill and early installation adjustment
Backfill relaxation, settlement or incomplete contact may allow the casing or sensors to change attitude in a direction opposite to the slope movement. Such behaviour is recorded in USGS landslide monitoring data.
Clues: small changes occur soon after installation, affect selected segments and gradually stabilize. These are clues, not proof; there is no universal rule that a few millimetres are always acceptable.
Action: check installation and backfill records, repeat observations and compare segment behaviour with system repeatability. Select an appropriate reference epoch after confirming stability, while retaining early data and the link between baselines. Continued growth or agreement with other monitoring requires further investigation of real deformation.
4. Twist in the inclinometer casing
For equipment whose measurement direction follows the grooves, casing twist changes the sensor-axis orientation with depth. Summing readings without correcting their directions may mix the components.
Distinguish twist already present and unchanged since the baseline from axis rotation after the baseline. The former primarily affects directional interpretation. The latter can also mix an existing transverse tilt into the difference between epochs, creating apparent displacement. A small, fixed twist does not necessarily produce negative X. See the DGSI spiral sensor manual and rotation-error guidance.
Clues: inconsistent directions with depth, records of casing torsion, or changes following a change in orientation.
Action: investigate orientation and its history along the borehole. With reliable azimuth data, transform each segment and epoch into a common coordinate system before differencing and accumulation. Head orientation alone cannot correct different twists at different depths. Missing historical orientations cannot be recovered simply by assuming that a negative curve is wrong.
An installation that separates guide-wheel rotation from sensor orientation can reduce the influence of casing grooves. The borehole-head direction still needs its own check.
5. The bottom reference is moving farther
A curve calculated with the bottom set to zero represents displacement relative to the bottom. It can be interpreted relative to stable ground only if that reference is actually stable. See the DGSI inclinometer manual.
For example, during the same period:
- The borehole head moves 5 mm downslope.
- The bottom reference moves 20 mm downslope.
- The head is displayed as 5 − 20 = −15 mm after bottom referencing.
Both locations moved downslope. The head simply moved 15 mm less than the bottom.
Clues: surface observations show downslope movement while the relative profile is negative, and it is uncertain whether the borehole crosses the moving zone into stable ground. A plotted zero at the bottom is not evidence of stability.
Action: verify the reference depth. If it moves, independently surveyed head displacement from GNSS or a total station can constrain the profile. Both datasets must refer to the same physical point, time baseline and coordinate direction. A borehole extending into stable ground may be required. Merely setting the head to zero does not establish absolute displacement either.
6. Sensor or calibration faults
For a calibrated instrument that passed known-direction checks, investigate the preceding causes before assuming it cannot distinguish positive from negative.
Clues: in a controlled test, raw readings consistently respond in the opposite direction when the sensor is tilted according to its physical positive-axis mark. Small negative offsets and temperature drift are different issues.
Action: follow the model’s manual for positive/negative tests before installation or after retrieval. Compare raw readings with the platform output. Correct raw response with reversed platform output points back to configuration or calculation. Abnormal independent readings require manufacturer inspection, recalibration, repair or replacement. Such checks are also described in the GEOKON pre-installation instructions.
Negative values describe direction and relative change. Establish the coordinates, installation condition and reference point before interpreting the curve. If those are reliable, retain the measurements and investigate their geological meaning. Do not change negative values to positive merely to match expectations.
Related reading: Casing twist and sensor orientation.