SINOMACRO CloudSafety Monitoring & Early Warning Cloud Platform
From monitoring data to warning and response
The Safety Monitoring & Early Warning Cloud Platform connects multi-source monitoring, risk assessment, graded warnings and response tracking. Field data, trigger evidence, notification acknowledgements and response records are organized around each event, with project-specific inputs, rules and channels.
Understand changes. Review the evidence. Follow the response.
The following describes the platform’s functional design using demonstration interfaces. Screens, scenarios and values are simulated. Available functions, analysis models and notification channels are subject to project configuration and delivery confirmation.
01
Compare multiple data sources to understand the sequence of change
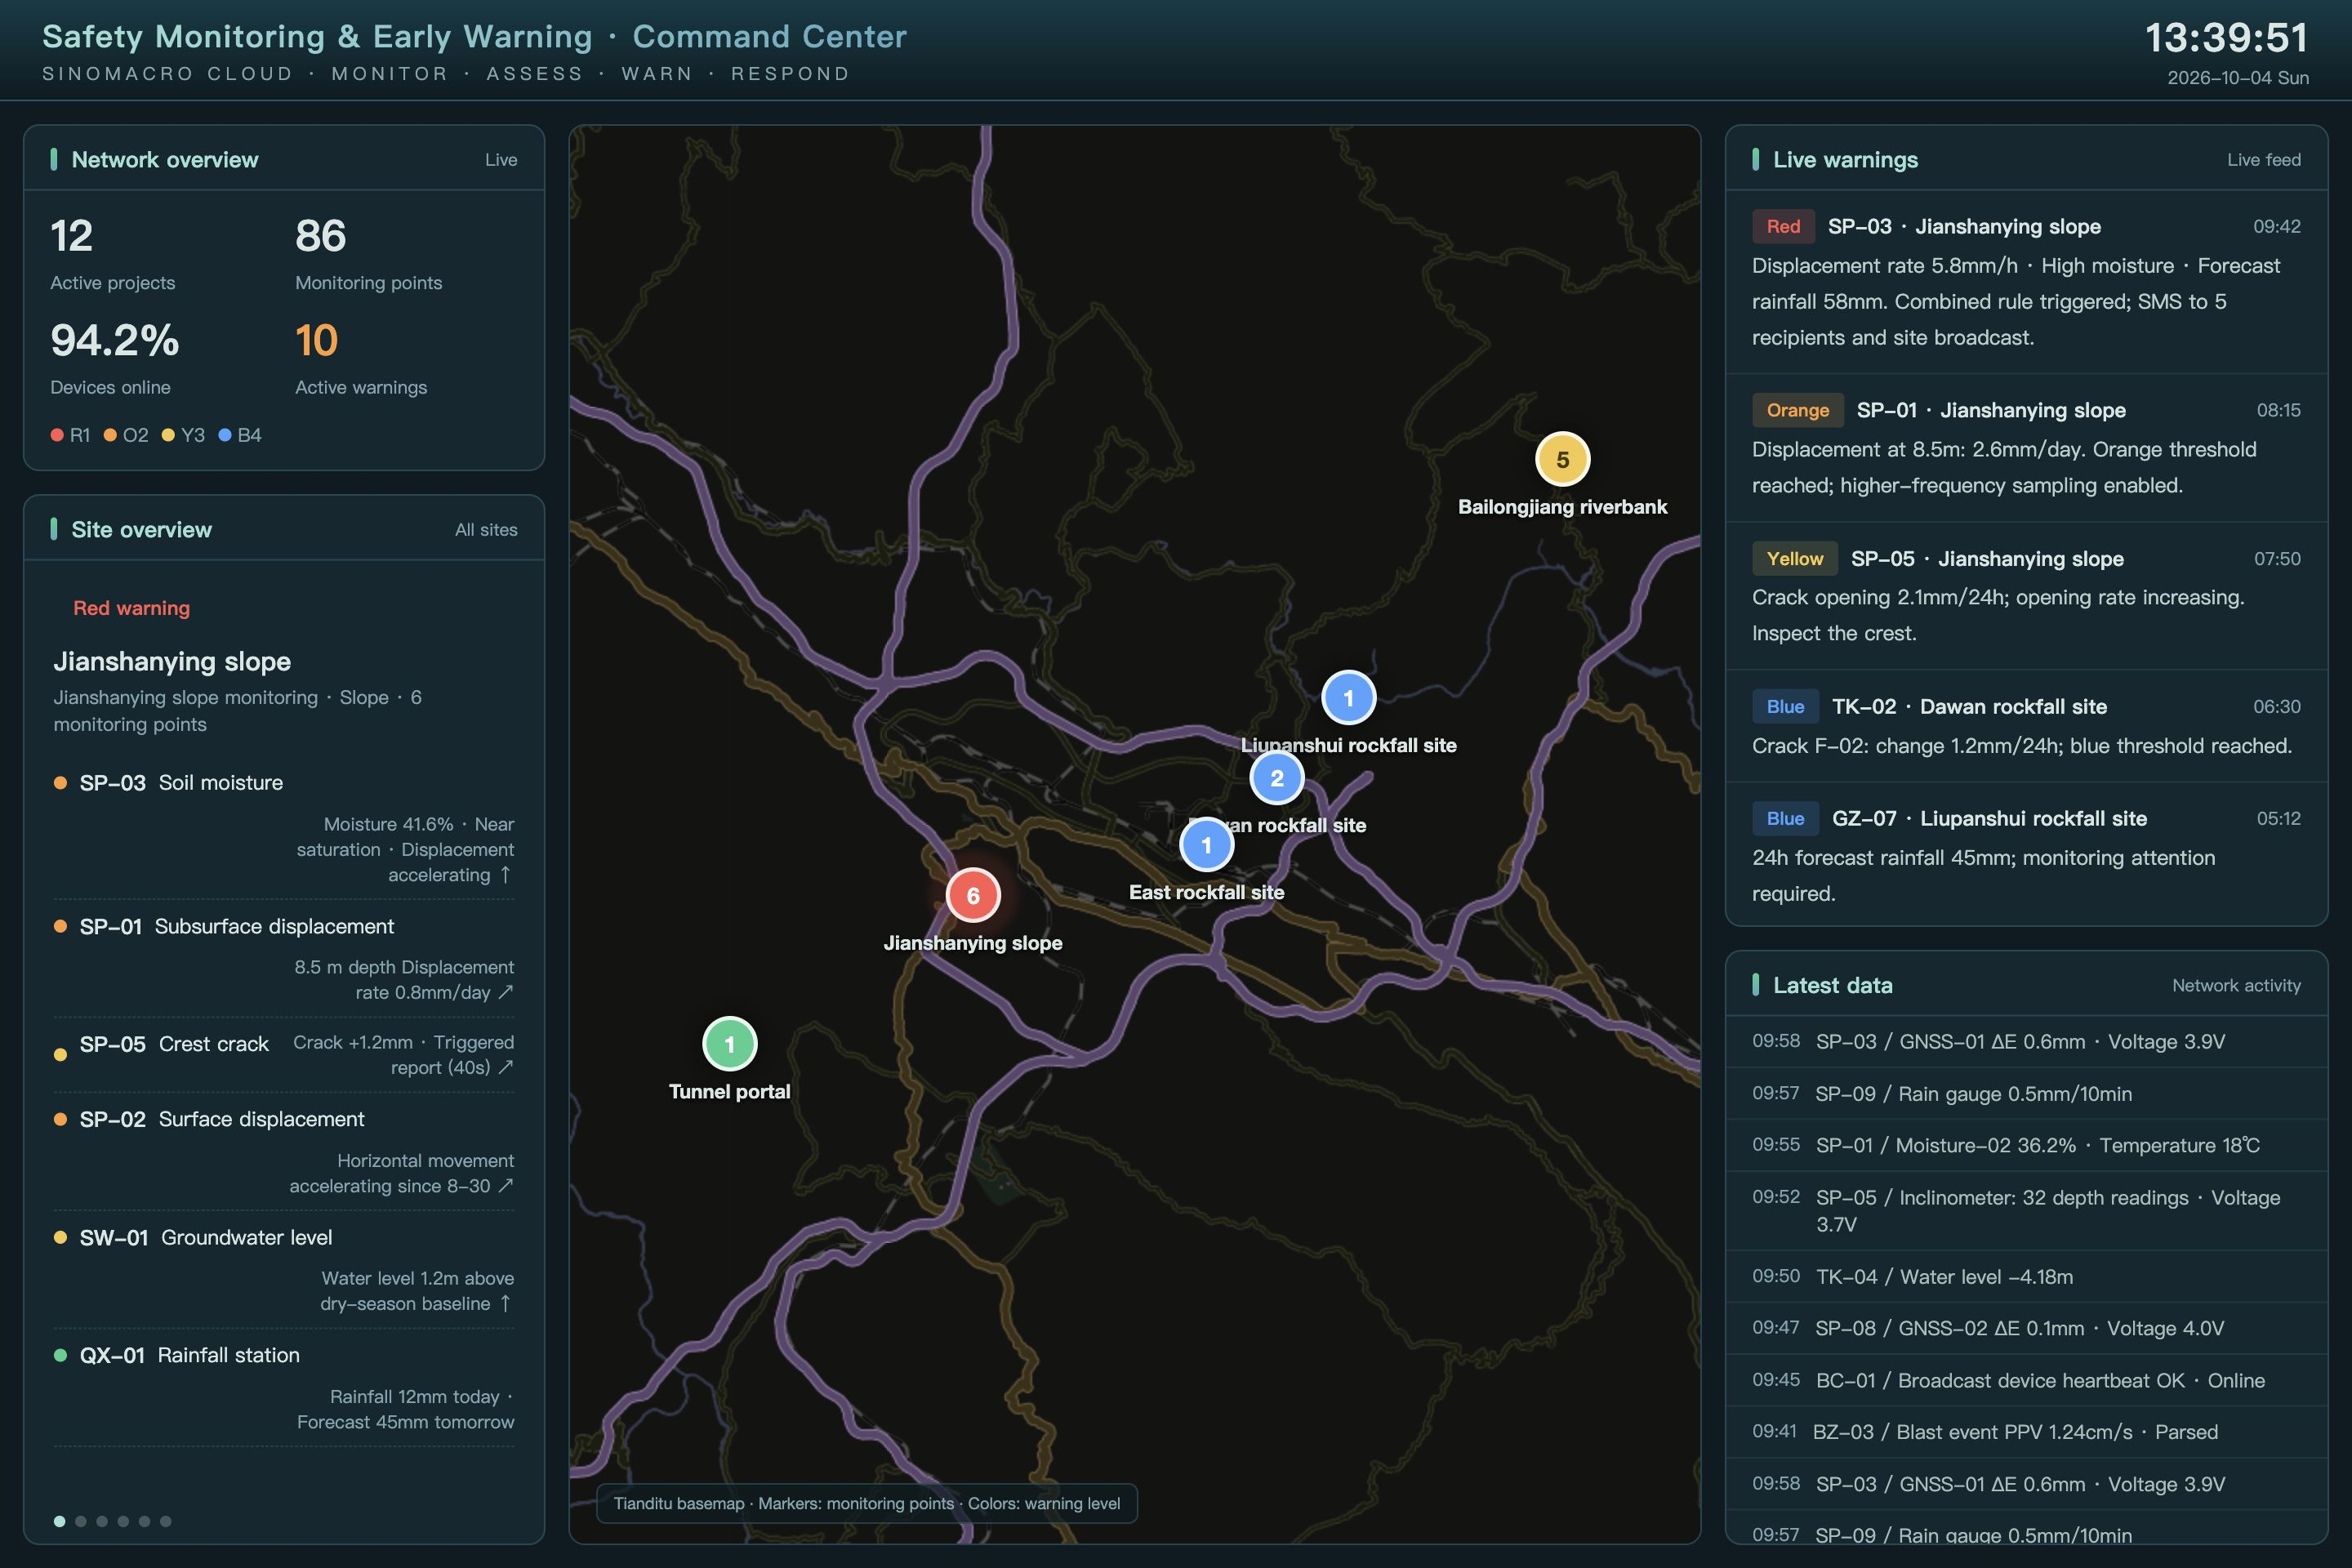
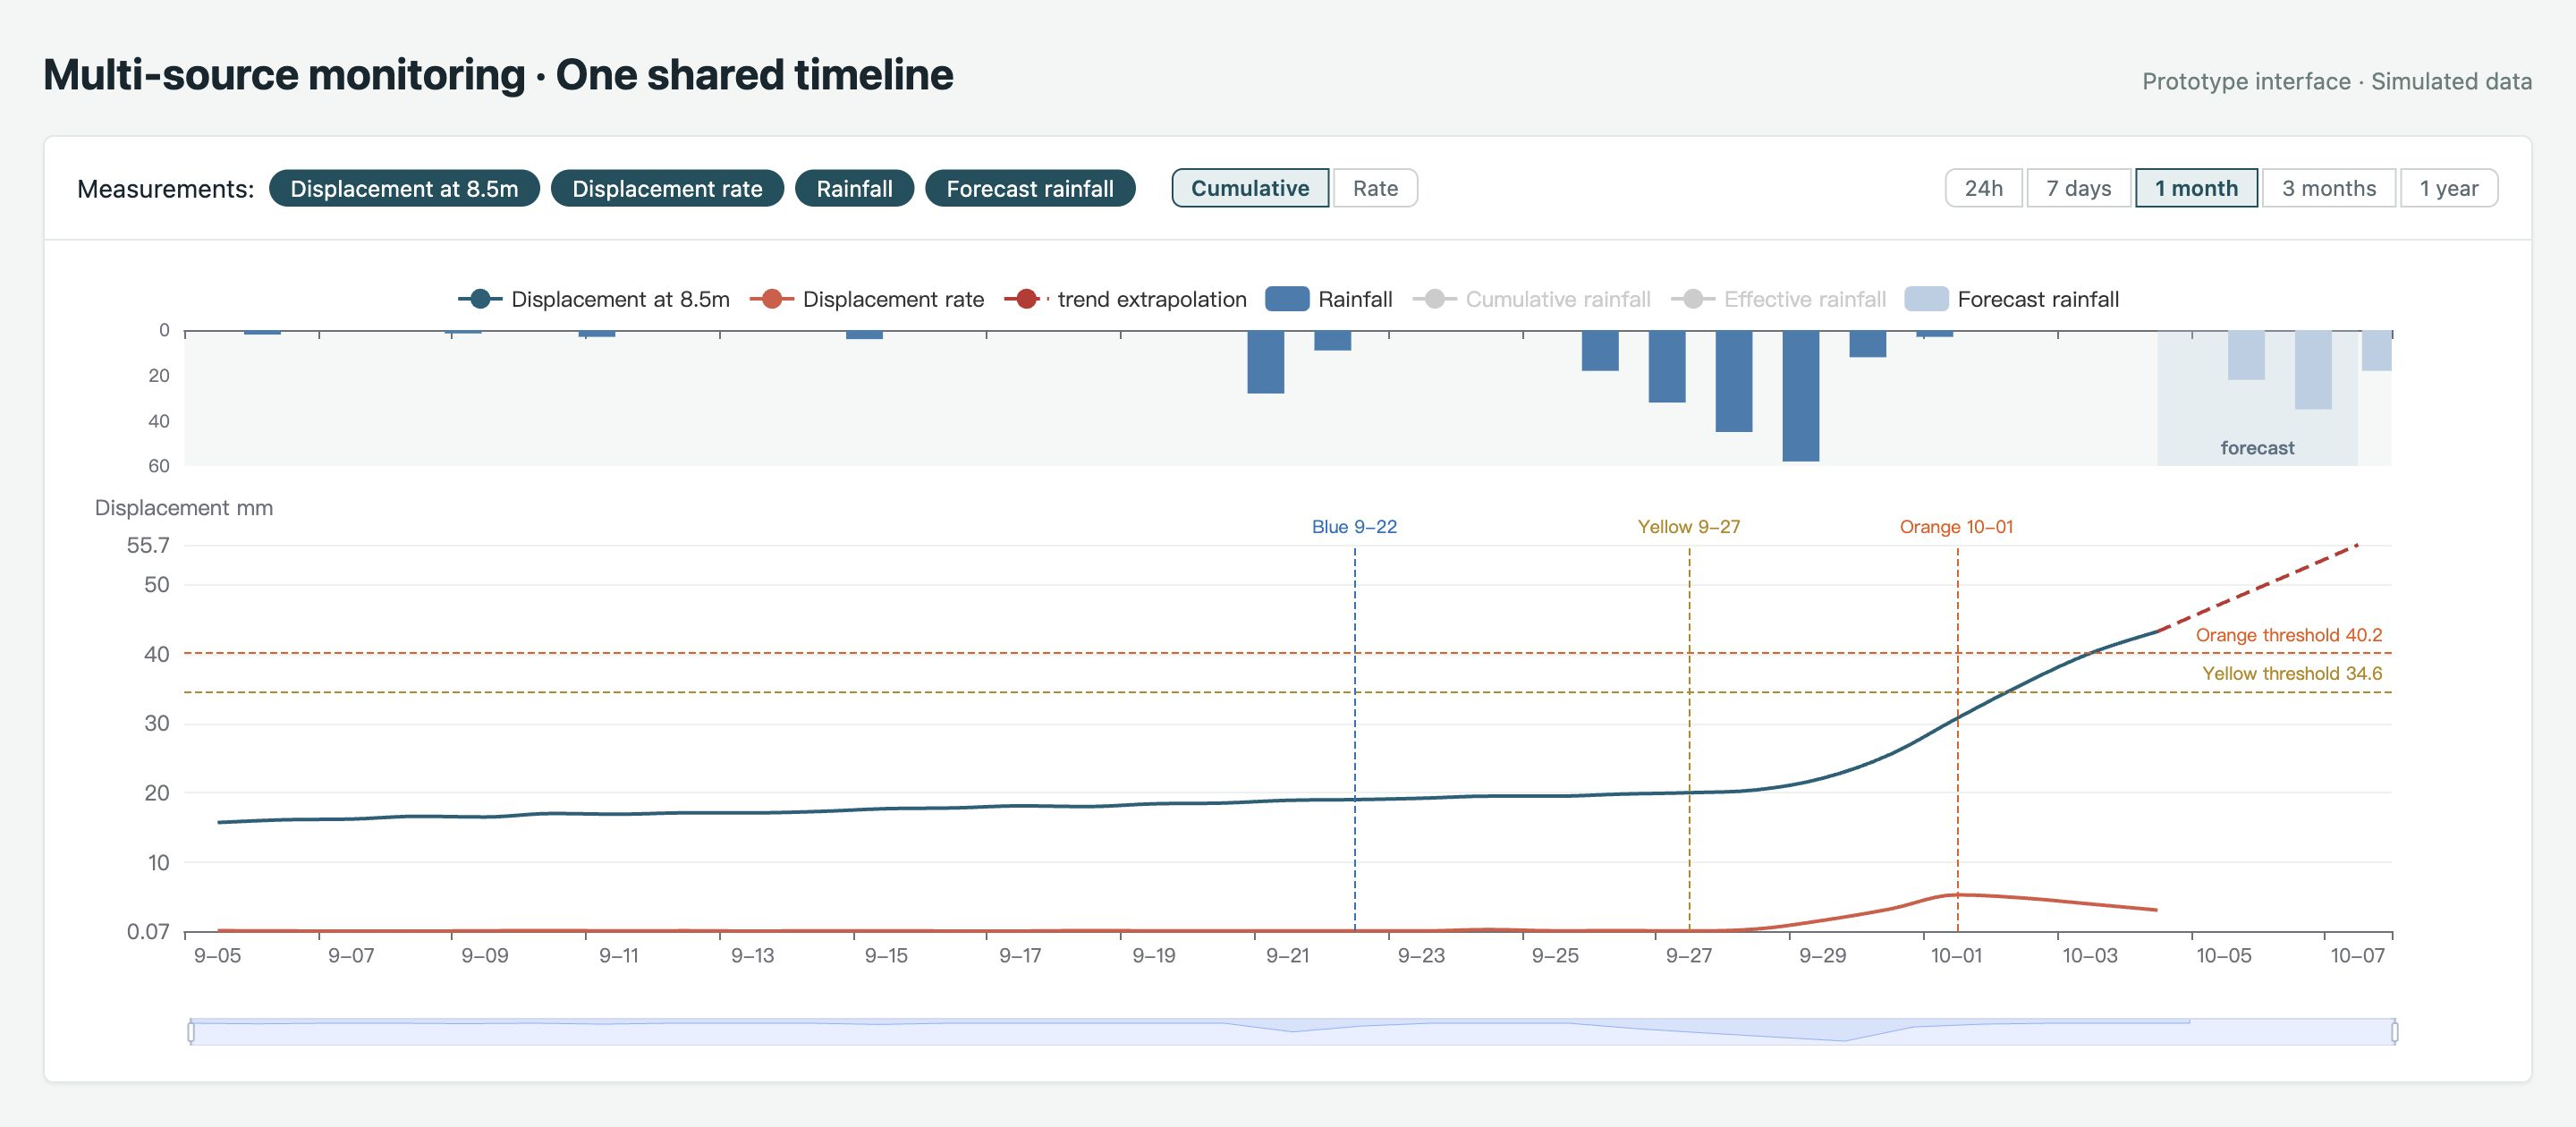
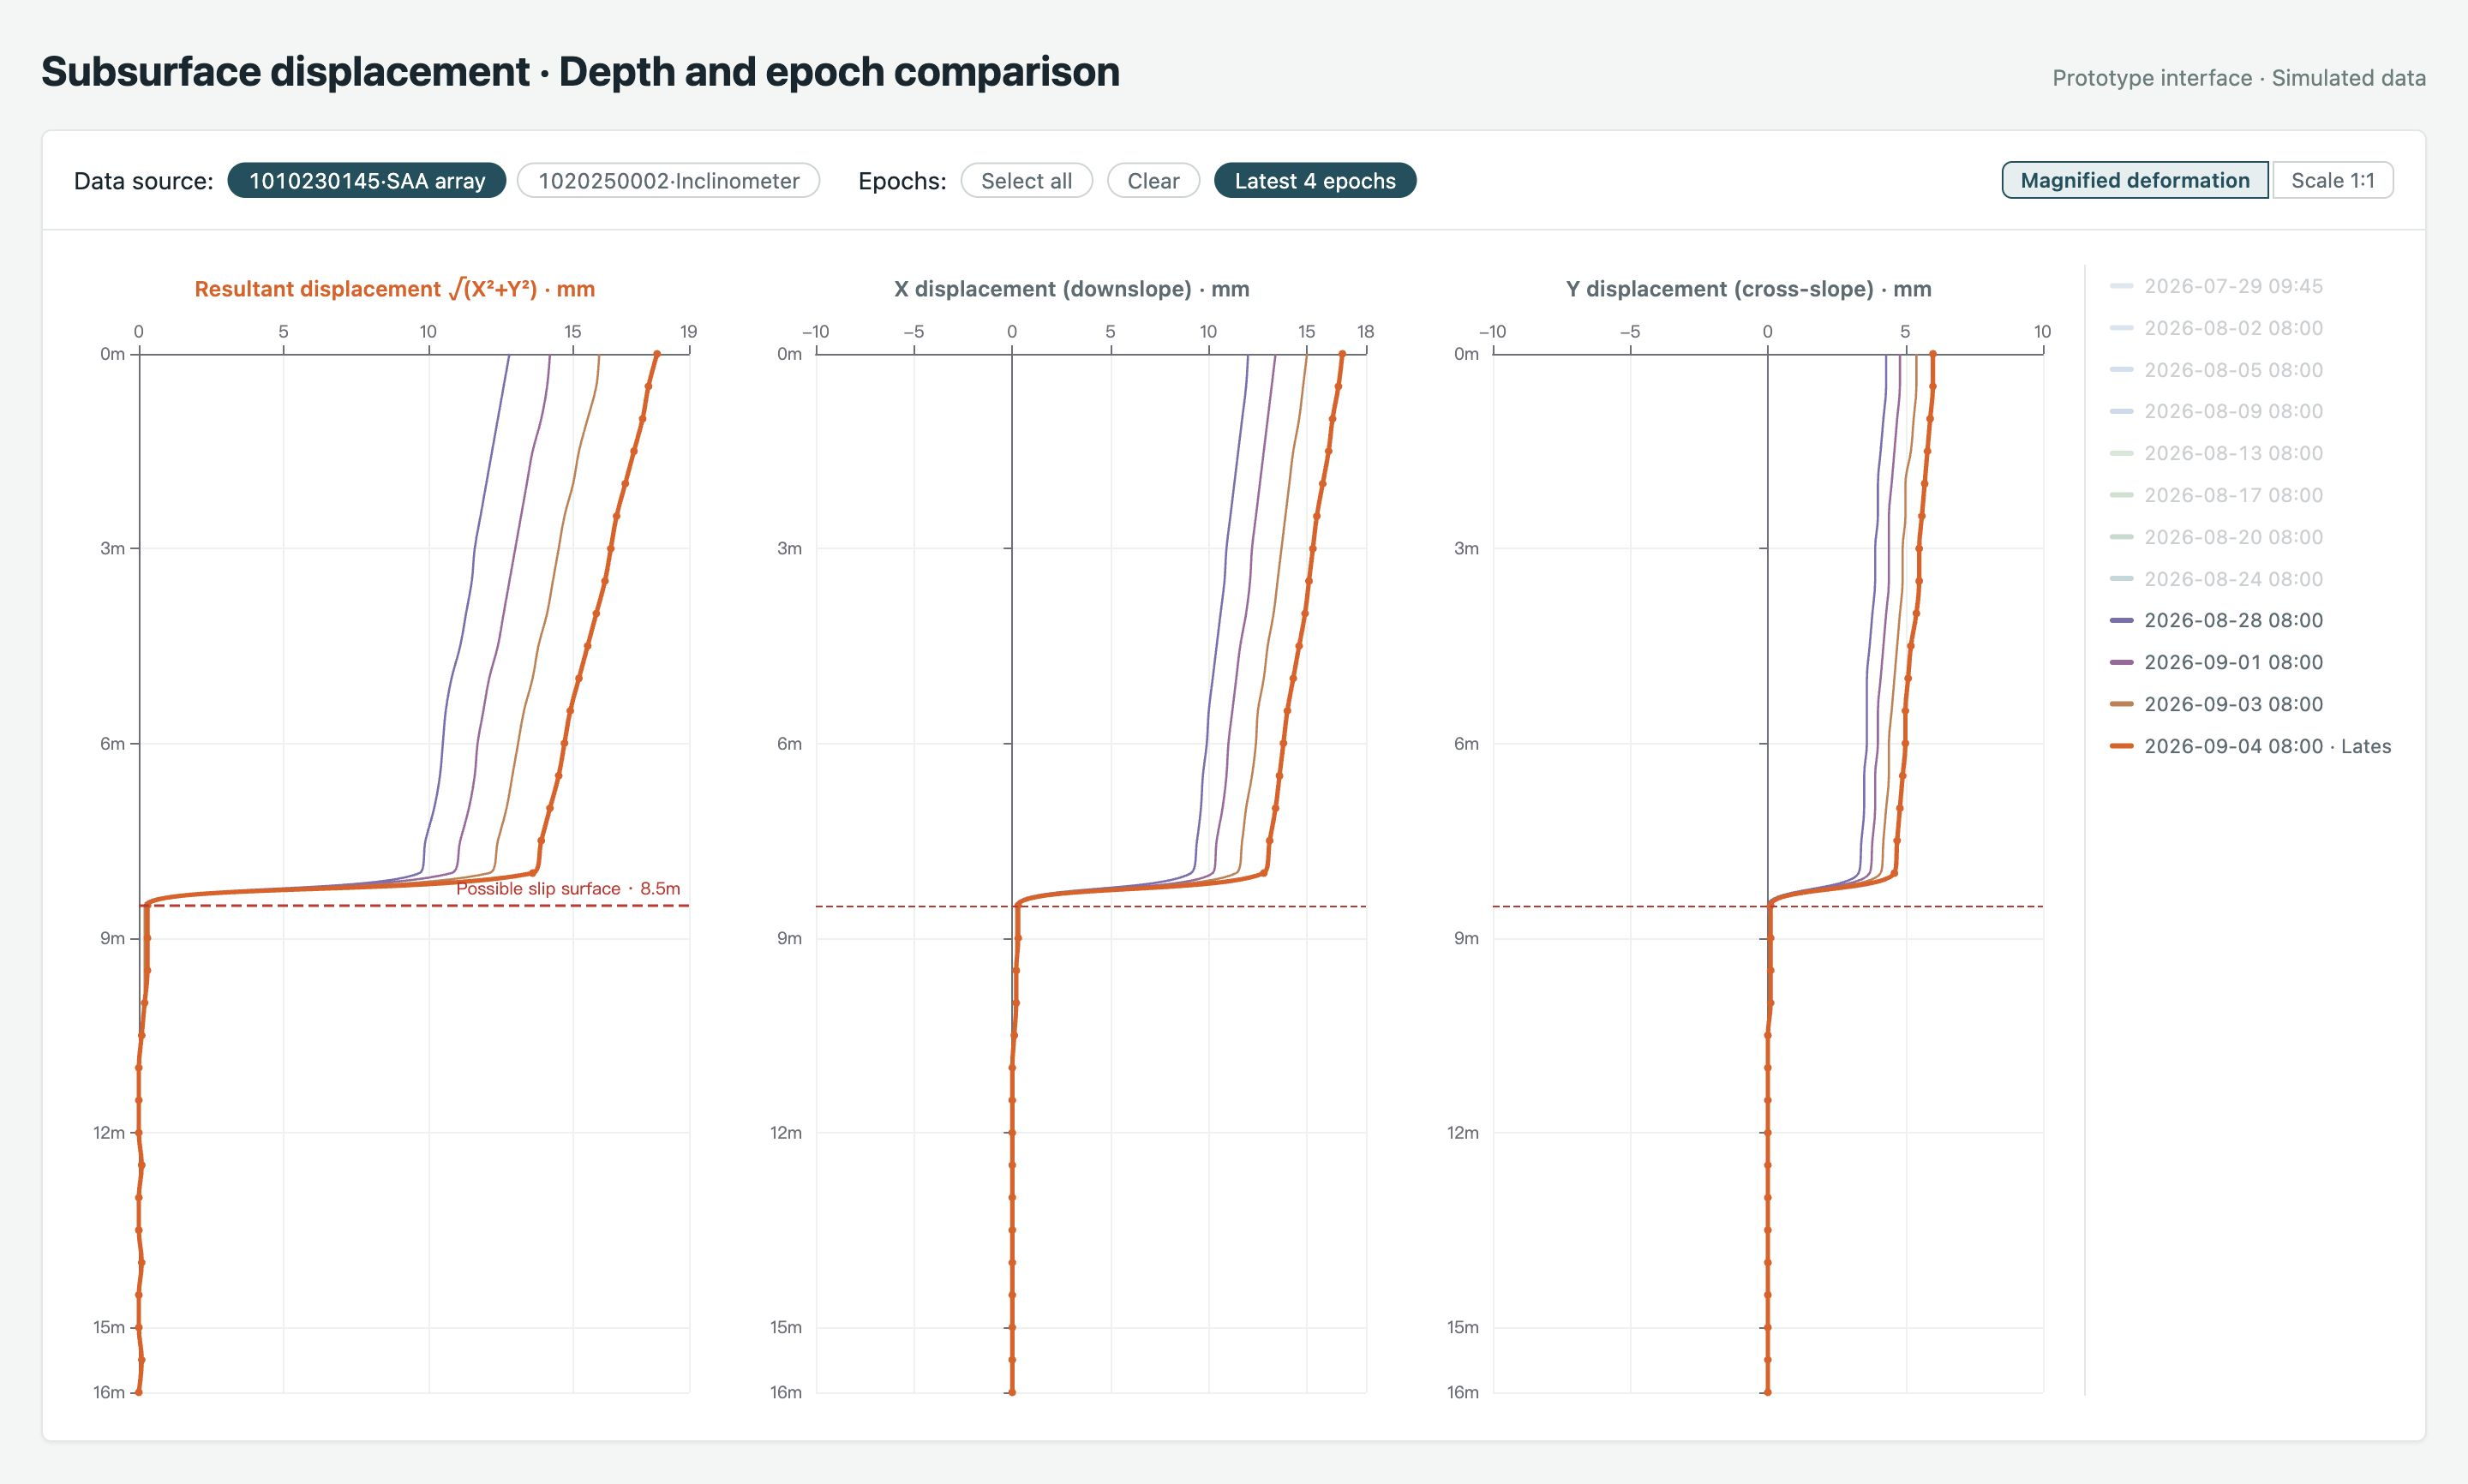
Locate a hazard site on the map and review its monitoring points, device connectivity and historical data. Compare rainfall, soil moisture, surface displacement and subsurface displacement on a shared timeline. Depth profiles and correlation analysis help assess the order, lag and persistence of changes.
Interface example · Demonstration data · Open image to view details
02
Configure graded rules and review how warnings are triggered
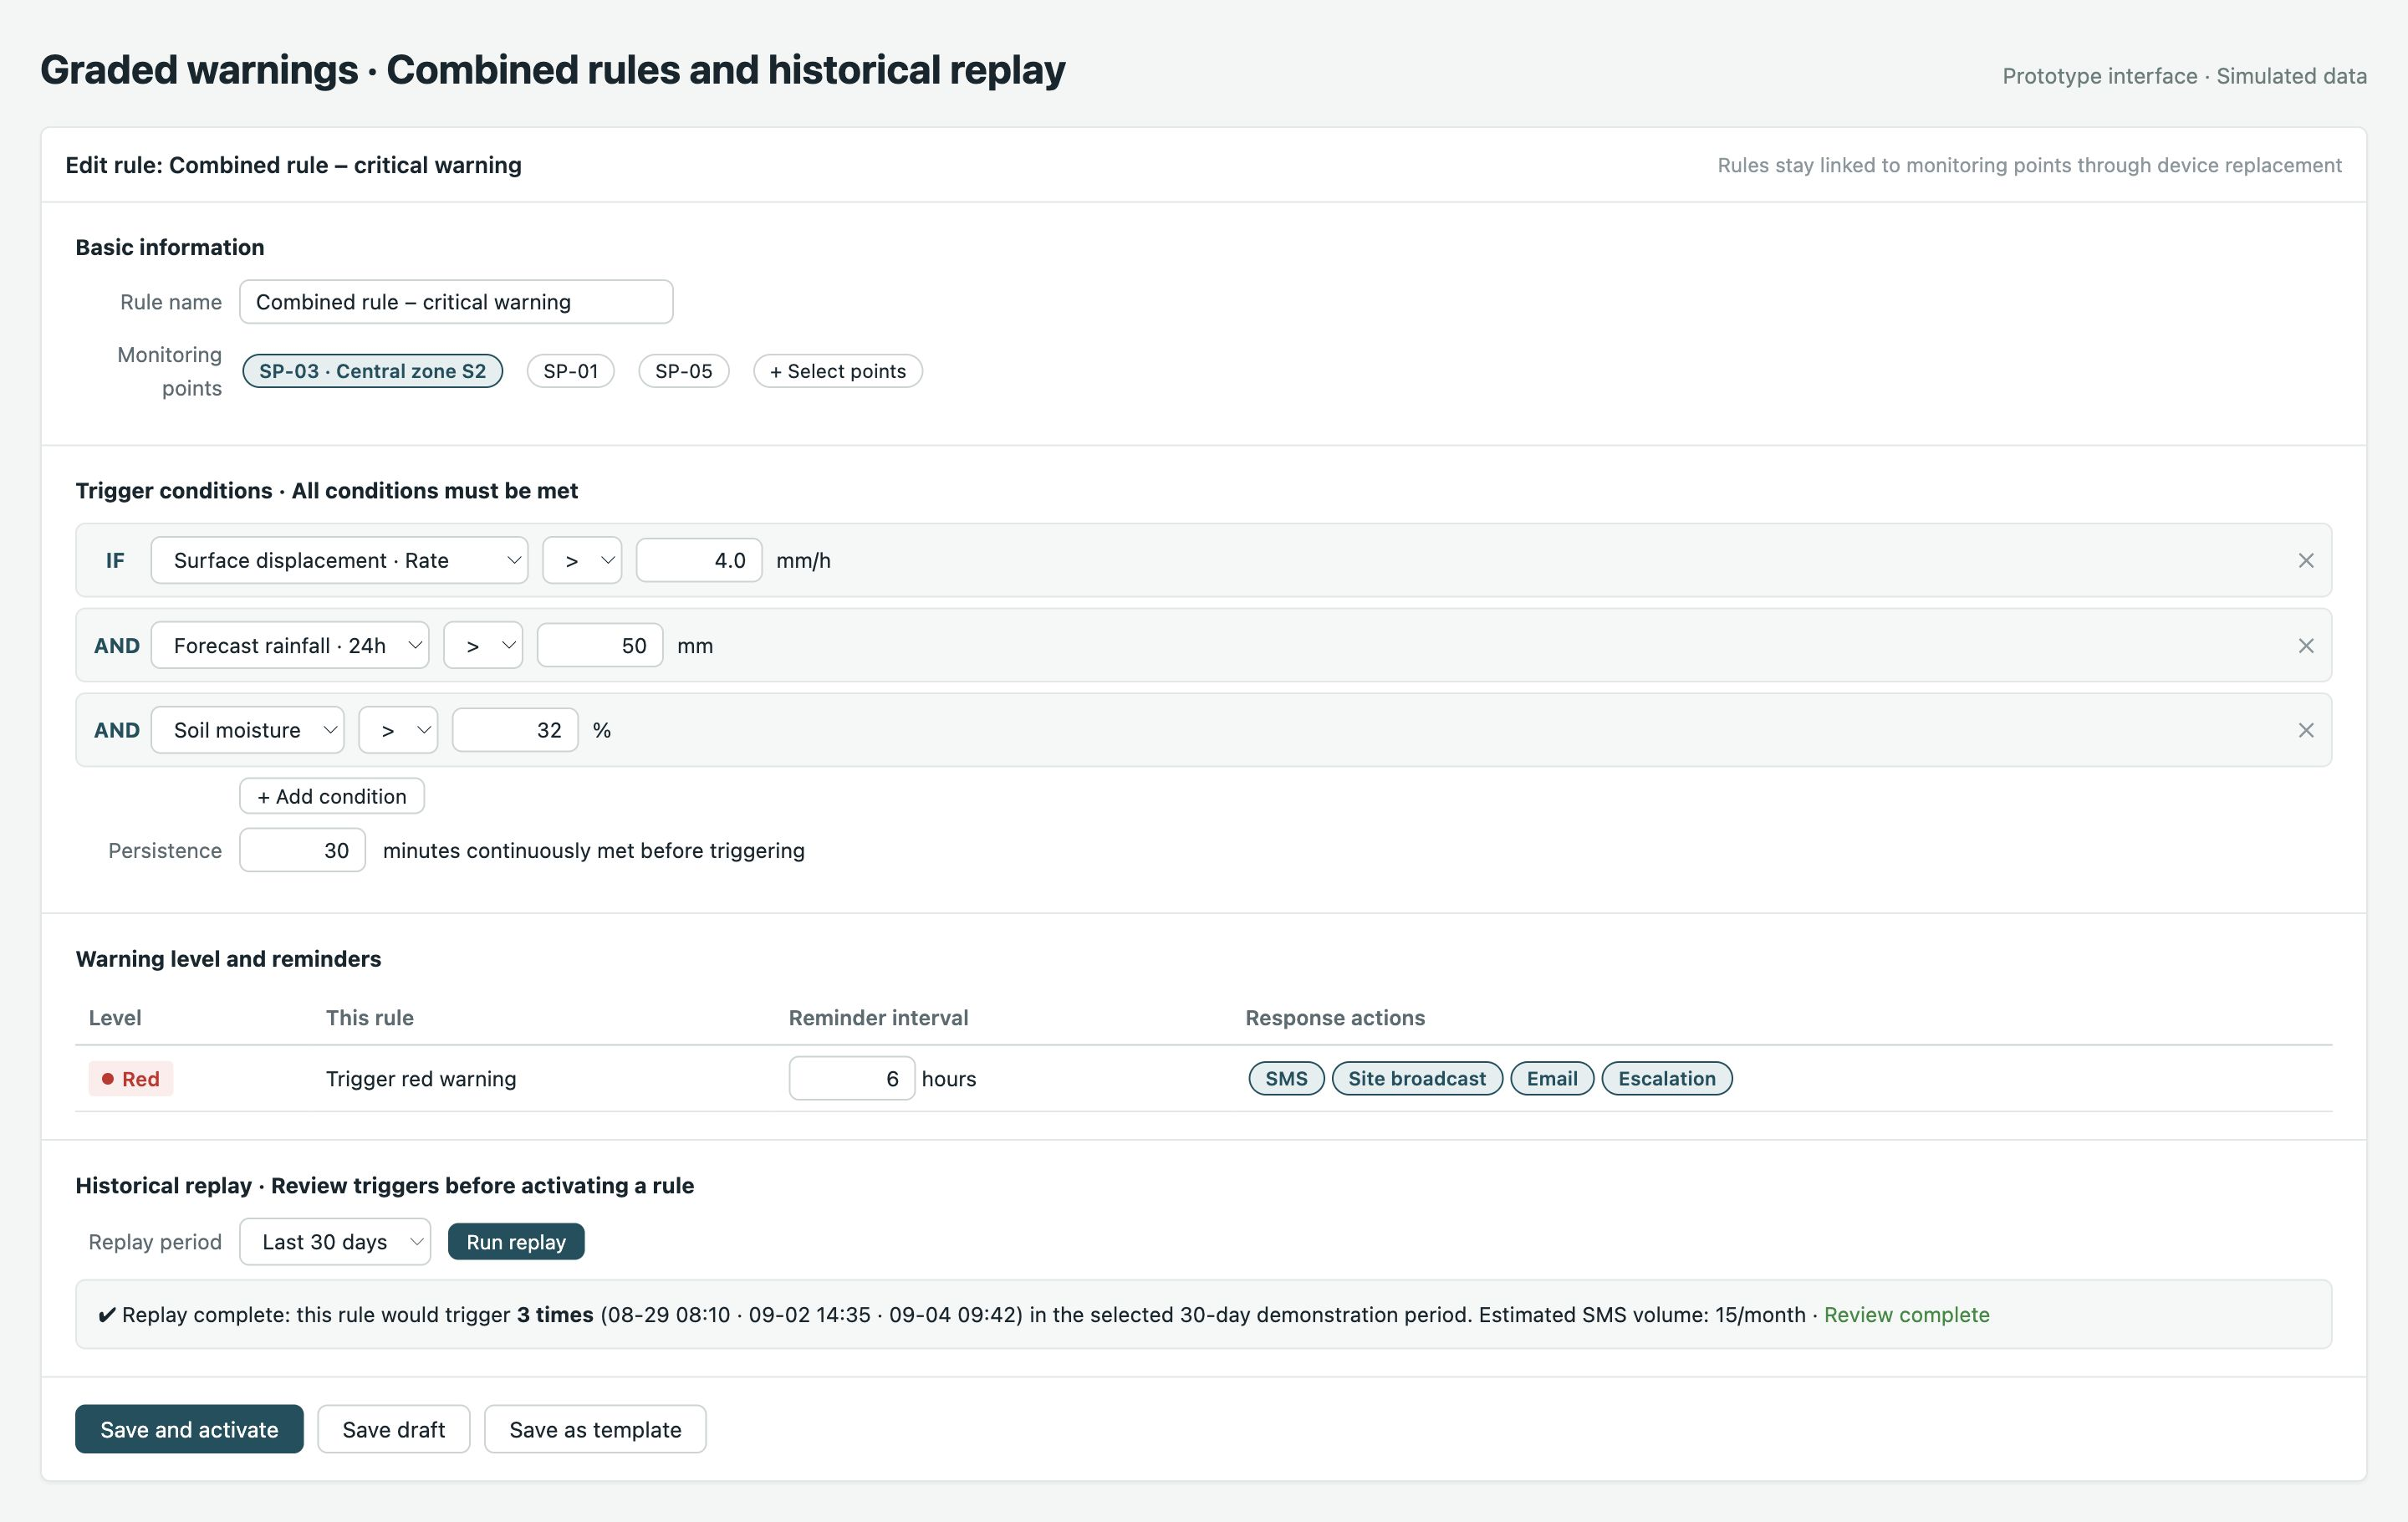
The rule design covers thresholds, changes, rates, persistence, combined conditions and rainfall intensity–duration conditions. Configure blue, yellow, orange and red warnings to match the project response plan. Templates, historical replay and version records help review trigger times, notification volume and rule changes.
Interface example · Demonstration data · Open image to view details
03
Make the evidence behind each warning available for review
Review abnormal readings, matched conditions, relevant curves and analysis results together. Check data quality, actual time intervals and model applicability before calculation. Correlation and extrapolation support professional assessment; measured and predicted information are identified separately. AI explanations do not determine warning levels.
Interface example · Demonstration data · Open image to view details
04
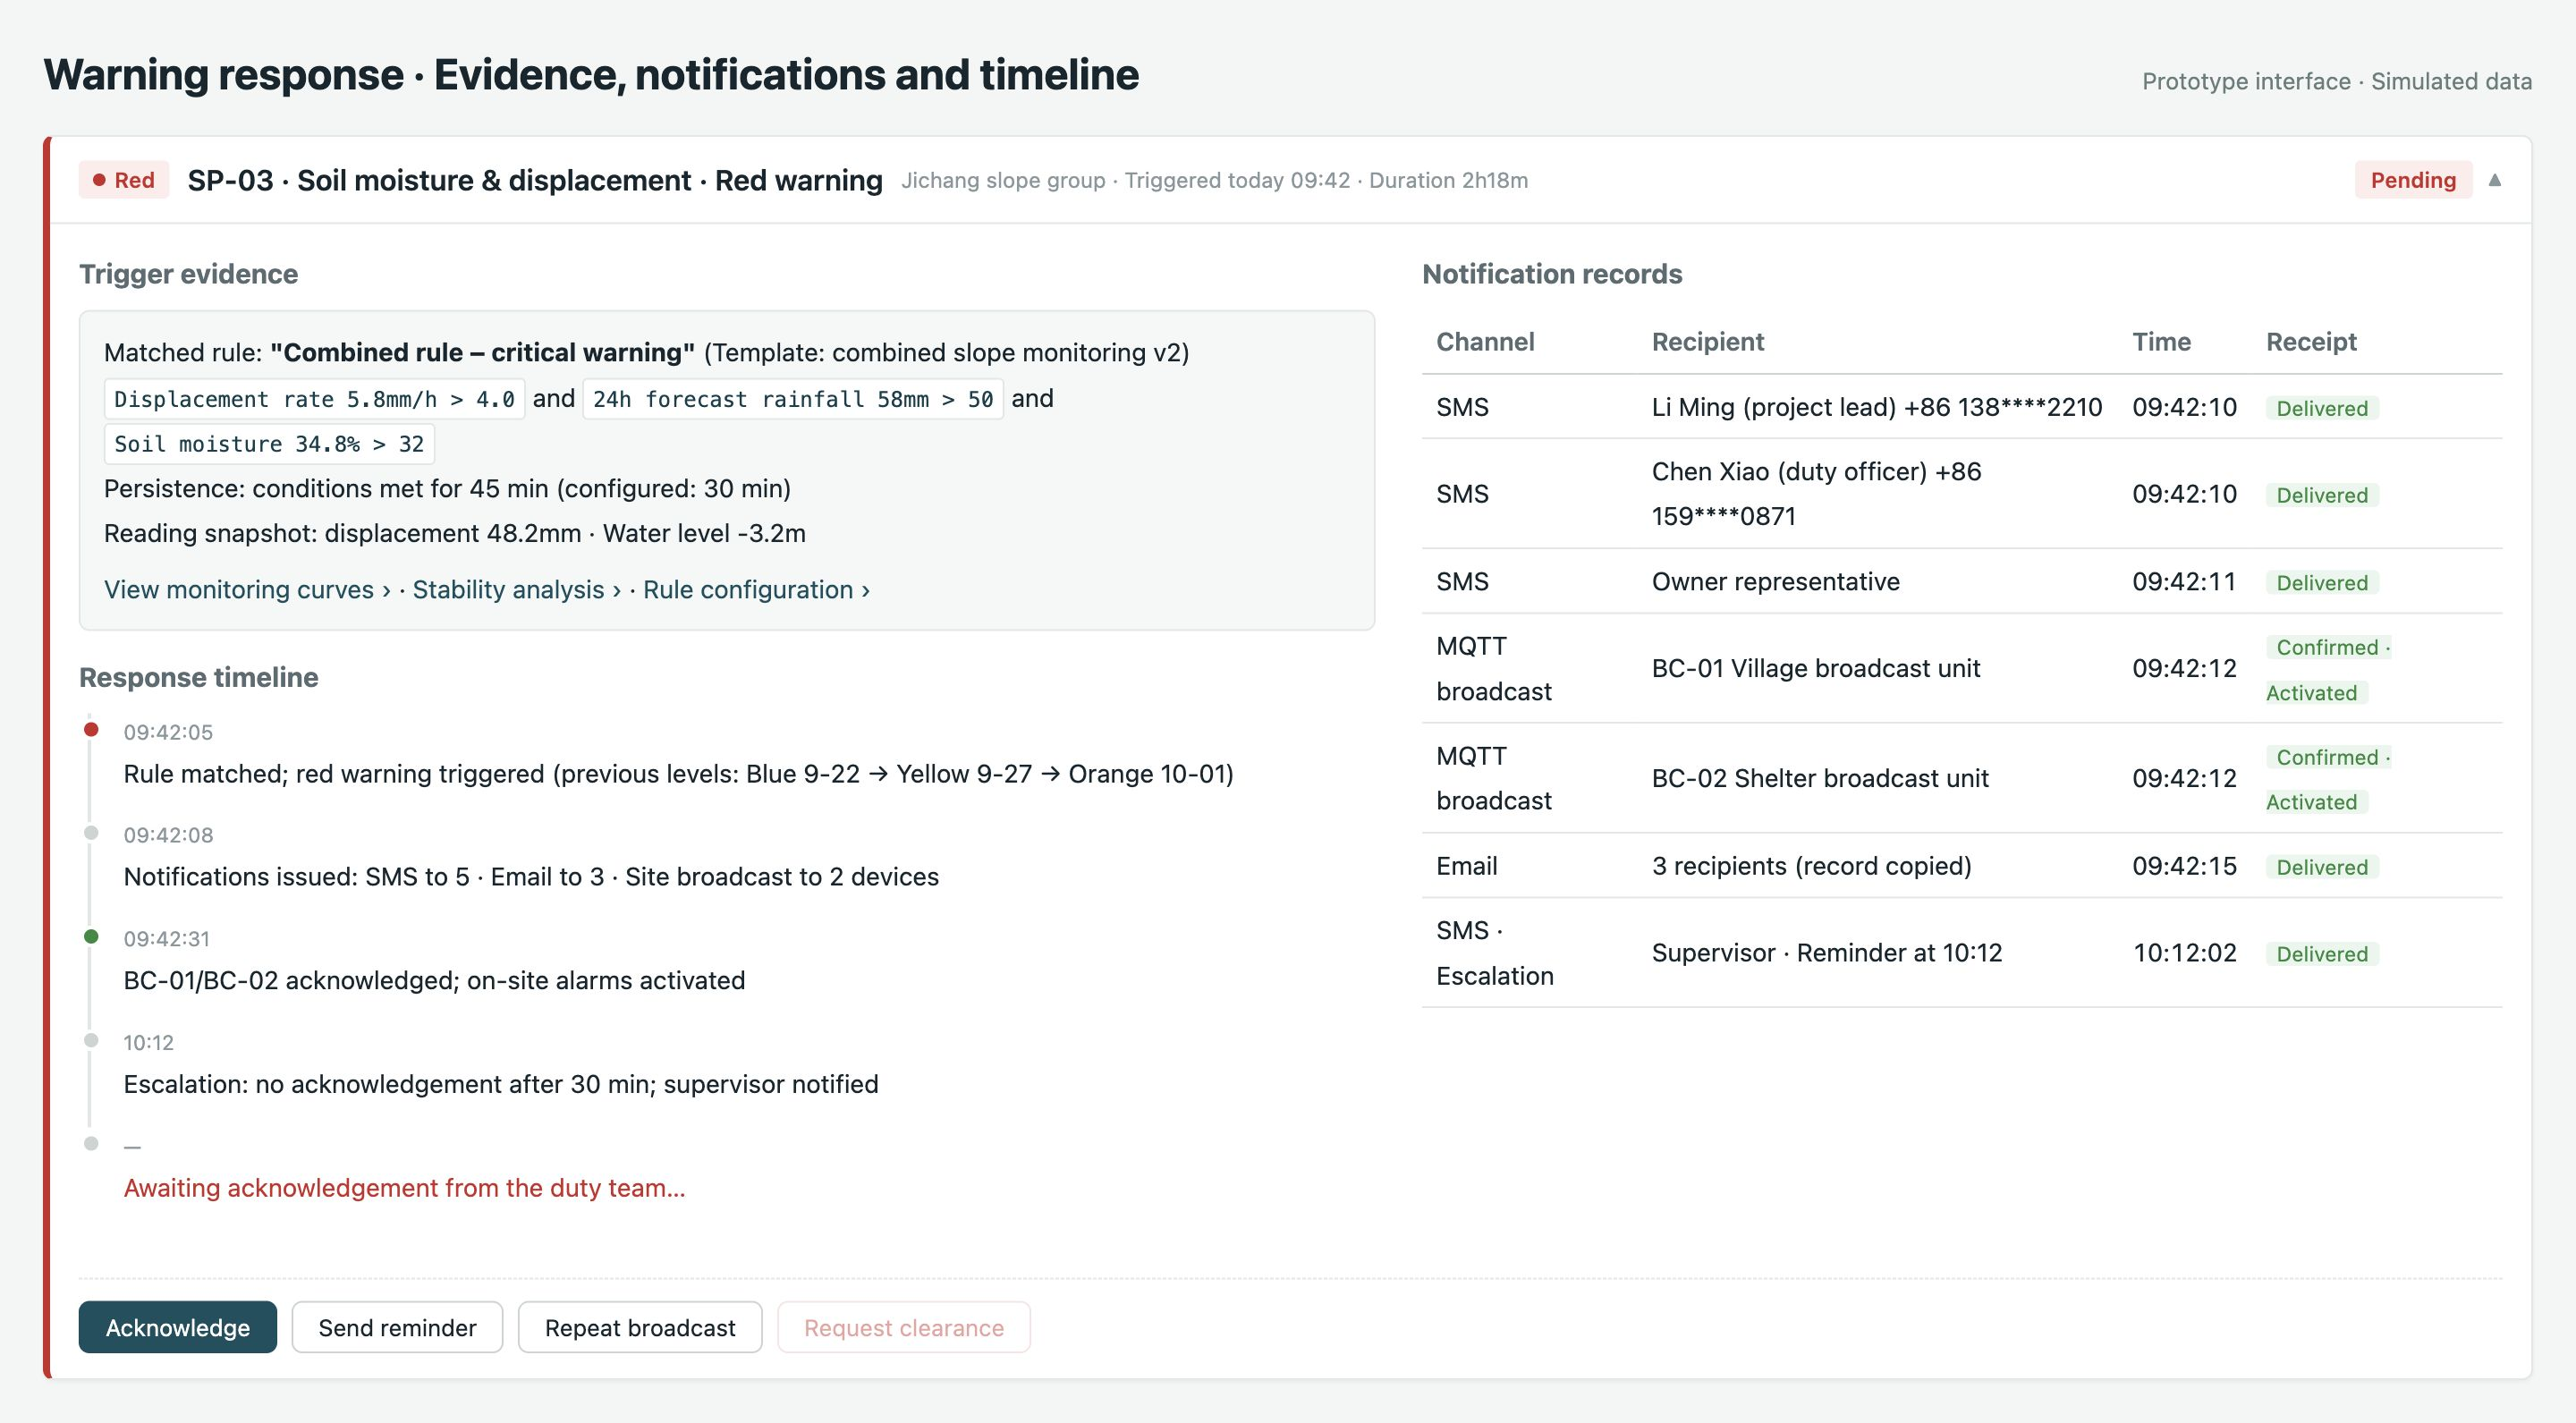
Track notification, acknowledgement and response
Configure responsible personnel and notification channels by warning level, and track sending, delivery receipts and acknowledgements. Unacknowledged events can prompt repeat reminders or escalation as configured. A timeline connects triggers, notifications, acknowledgements, actions and clearance review. On-site broadcasting requires compatible equipment; field actions follow the project response plan.
Interface example · Demonstration data · Open image to view details
Applications
Typical applications
Multi-parameter slope and landslide monitoring
Dams and hydraulic structures
Bridges, tunnels and building structures
Distributed sites and multi-project warning management
Depending on device and interface configuration, inputs may include rainfall, soil moisture, water level, surface and subsurface displacement, tilt and crack measurements. Data fields, sampling rates and remote settings require project-specific confirmation.
Are warning levels and thresholds fixed?
Warnings use blue, yellow, orange and red levels. Variables, thresholds, calculation windows, persistence conditions and response actions are configured for the monitored asset, historical data and project response plan. Demonstration angle ranges and values are not universal criteria.
How is a warning followed through to a response?
The workflow design includes level-based notifications, sending and delivery records, acknowledgement by responsible personnel, overdue reminders or escalation, response tracking and clearance review. Channels and broadcasting equipment are configured for the project; field actions follow its response plan.
Can models or AI directly predict failure time and probability?
Extrapolation and stability analysis depend on suitable data, parameters and model applicability, and only support professional assessment. The proportion of unstable model samples is not a validated probability of a disaster in the next 24 hours. AI assists explanation and reporting without determining warning levels.
Do these screens show a measured project or a delivered product interface?
The illustrated interfaces demonstrate platform functions. Scenarios, data, rules and warning events are simulated; they are not field case evidence or validated prediction performance. Functions, deployment, redundancy, models and channels are subject to the project specification and delivery confirmation.